Access to stable housing is a key determinant of health and well-being. Once an individual has the resources to afford shelter, the decision to rent or own comes to the fore. A prior feature article, Rent or Own? The Demographics of Housing in Tucson presented evidence on the prevalence of renter-occupied dwellings in Tucson, compared to peer western metros. The results demonstrated that in 2018, rental units accounted for 37.6% of total occupied units in Tucson. That was above the national rate of 36.2% and ranked Tucson sixth out of 12 peer metros.
Let’s turn our attention to the cost of renting a dwelling. The United States Department of Housing and Urban Development (HUD) estimates Fair Market Rent prices annually for the next fiscal year. HUD calculates the Fair Market Rent (FMR) price as the 40th percentile of gross rents in a local housing market. HUD typically excludes low-quality units, subsidized units, and units built in the last two years. Fair Market Rent prices commonly use recent move-ins rather than long-term tenants who generally pay a lower monthly rental rate. Included in Fair Market Rent prices are primary utilities like electricity and water. HUD uses the latest available five-year gross rents data from the Census 5-Year ACS survey as the basis for their calculations. HUD then multiplies the base rent by a recent mover factor, the gross rent CPI, and a trend factor to produce a rent that is “as of” the current or upcoming fiscal year. Data for the 2022 fiscal year was recently released from HUD. The FMR prices will become effective October 1, 2021.
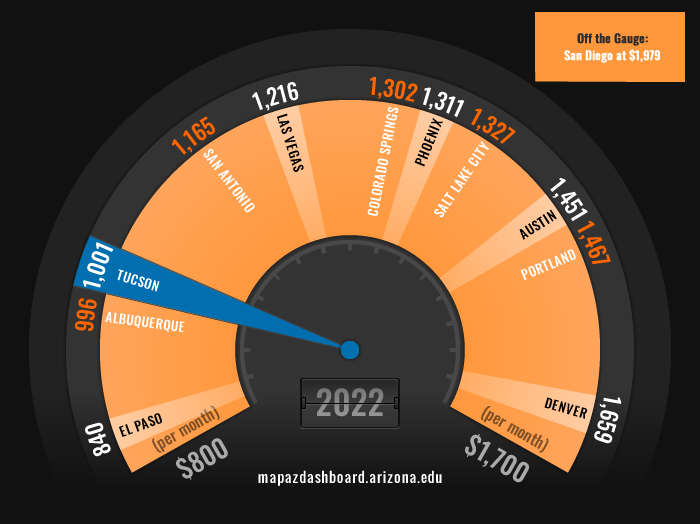
When compared to peer western MSAs, Tucson posted the third-lowest FMR monthly rent for two-bedroom units (Figure 1), according to data from HUD. El Paso posted the lowest Fair Market Rent price of $840, while San Diego posted the highest at $1,979. Just as rental prices in Tucson are affordable relative to peer metros, so are single-family homes. Tucson boasts the highest percentage of affordable homes in 2020. The caveat is that rents and purchase prices are only affordable to some.
Figure 1: Fair Market Rent for a Two-Bedroom Unit (2022)
Tucson ranked well compared to peers in rent prices for a two-bedroom unit. That was consistent with its ranking in single-family home prices. Generally, regions with higher rent prices also have higher home prices. This trend held for all rental types from studios to four-bedrooms. For instance, Tucson had the second-lowest price for studios, one-bedroom units, and four-bedroom units when compared to peer western metros.
As the figures show, Fair Market Rent prices in Tucson will vary from $665 for a studio to $1685 for a four-bedroom in 2022. Keep in mind that the FMR for the federal fiscal year 2022 was published in 2021. Use the drop-down menu in Figure 2 to select the number of bedrooms for each rental unit by geography.
Figure 2a-e: Fair Market Rent by Number of Bedrooms (2022)
The price that individuals pay for rent matters because mortgage prices or rent is often the largest monthly expense for a household and can affect spending in other areas. Personal consumption makes up the better part of the economy, and the cost spent on housing influences discretionary income levels. Therefore, rent prices are an important factor in the local economy. If housing expenditures (including utilities) for renters and owners exceed 30 percent of the household's income they are considered cost-burdened. Cost-burdened households are more likely to struggle to pay for basic needs such as healthcare, childcare, transportation, and even food. In 2019, Tucson had the fifth-highest percentage of cost-burdened households that were renters at 51.0% when compared to peer western MSAs (Figure 3).
Figure 3: Percentage of Renter Households that are Cost-Burdened (2019)
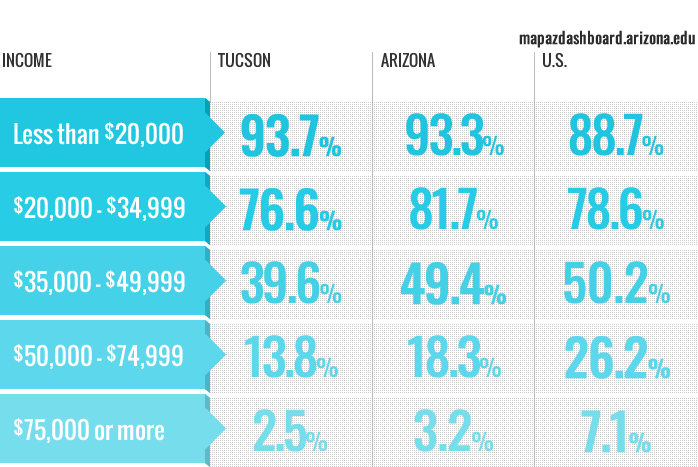
We can explore housing cost burden rates for renters by income. When we do this, it becomes evident that renters in the lower-income brackets struggle to find affordable options. Of the total renter-occupied households that are considered housing cost-burdened in the Tucson region, 71.6% of them earned less than $35,000, while less than 1% of renter-occupied cost-burdened households fell in the $75,000 and over income bracket (Figure 4).
Figure 4: Distribution by Income of Renter-Occupied Housing Units that are Housing Cost Burdened (2019)
The distribution of renter-occupied housing units considered cost-burdened by income illustrates that lower-income households struggle to find affordable rentals compared to their higher-income peers. However, what is especially telling is the percentage of households within each income bracket considered cost-burdened.
In 2019, there were 36,586 renter-occupied housing units with households earning less than $20,000. Of that total, 93.7% (34,277 households) paid more than 30% of their income in rent. For renters in Tucson earning between $20,000 - $34,999, the percentage of those considered cost-burdened fell to 76.6%, which is still a staggering number of households. Nearly 40% of renter households earning between $35,000 and $49,999 were cost-burdened. The rate fell to 13.8% for those in the $50,000 - $74,999 income bracket. Renters in Tucson earning over $75,000 had the lowest housing cost burden rate at 2.5% (Figure 5).
Compared to the nation, those earning over $35,000 in Tucson had significantly lower rates of housing cost-burdened relative to their national peers. That highlights Tucson's affordability for those in higher income brackets. However, the high percentage of cost-burdened households at lower income levels demonstrates a lack of affordable housing for many.
Figure 5: Housing Cost Burden for Renters by Individual Income Bracket (2019)
The findings are especially concerning given the low median household income for renters in the Tucson region. In 2019, renter-occupied households had a median household income of $34,786. That was nearly $20,000 less than the median household income for all households in Tucson. According to a report by the Harvard Joint Center for Housing, households that rent differ in systematic ways from those that own a home. The report states that renters tend to be younger, the share of renters that are minorities is twice that of homeowners, and renter households are smaller on average, with over a third of renter households representing a single person. Additionally, household incomes for renters are lower than owners, and renters tend to have very little savings or wealth.
Using the 30% rule to determine how much renter-occupied households can spend on rent and utilities, we find that someone in Tucson earning the median income for renters can afford up to $870 in rent. That increases to $1115 in Phoenix. In Tucson, those who earn the median income for renters can afford the 2020 Fair Market Rent for a studio ($618) and a one-bedroom ($721) without being considered cost-burdened. However, the Fair Market Rent for a two-bedroom ($949), three-bedroom ($1369), or four-bedroom ($1618) would put those renters earning the median income well over 30% of their income.
Figure 6 illustrates what 30% of the local median income for renters was for each metropolitan area in 2019. That represents the threshold at which a renter would become housing cost-burdened. In 2019, those who earned the median income for renters in Colorado Springs, Las Vegas, Phoenix, and Salt Lake City could afford the Fair Market Rent for a two-bedroom unit without being considered cost-burdened. The latest available data for median income for renters is 2019.
Figure 6: Cost-Burdened Price Threshold for Renters (2019)
To illustrate further, we can explore the price level at which renters would be considered cost-burdened across varying income levels. A renter earning $20,000 a year would only be able to spend up to $500 a month on rent and utilities without being considered cost-burdened. At an income of $35,000, a renter could spend up to $875 before being considered cost-burdened. In 2020, the Fair Market Rent for a two-bedroom unit in Tucson was $949. A renter would need to earn approximately $38,000 to spend less than 30% of their income on rent and utilities for a two-bedroom unit in Tucson. Less than half of renters in Tucson earn $38,000 or more each year.
Figure 7 highlights the threshold price levels at which renters become cost-burdened. Further information about the gap in affordable housing can be found in the Tucson Housing Market Study on the MAP.
Figure 7: Cost-Burdened Price Threshold by Income Level
| Income Level | Price Threshold for Housing Cost Burden |
|---|---|
| $20,000 | $500 |
| $35,000 | $875 |
| $50,000 | $1,250 |
| $75,000 | $1,875 |
Over the past five years, rent prices accelerated across Tucson. For 2022, FMR for a two-bedroom unit increased by 15.5% since 2015. That is an average annual growth rate in rent prices for a two-bedroom of 3.1%. Tucson’s growth in rent prices between 2018-2022 was the fourth-slowest growth among peer western MSAs. Phoenix posted the fastest growth in FMR over those five years for two-bedroom units at 38.9%, which translated into 7.8% per year. Fair Market Rents in El Paso remained flat during that period. (Figure 8).
Figure 8: Growth Rate in Rent for a Two-Bedroom Unit (2022)
The increase in FMR varied slightly by the number of bedrooms with studio prices increasing the most in the Tucson region over the past five years at 20.9% (Figure 9). Fair Market Rent prices increased during that period in the Phoenix MSA at a pace more than double that of Tucson.
Figure 9: Growth Rate in Rent Prices by Unit Type (2022)
As illustrated in Figure 10, the five-year growth in rental prices for a two-bedroom unit was slower in Tucson than in Phoenix. Significant variation exists across regions and by year in rental prices for two-bedroom units. Tucson’s five-year growth in FMR for a two-bedroom has generally remained above 10 percent. However, in Tucson between 2012 and 2017 rent prices remained relatively flat. Figure 10 is interactive to view geographies other than Tucson click on/off the greyed-out name.
Figure 10: Growth Rate in Rent for Two-Bedroom Units
In order to accurately compare changes in rent and home prices, we must compare similar years of data. The last year of data available for home prices is 2020. Home prices in Tucson increased by 44.9% over the last five years of data (2015-2020). Rent prices also increased during that period in Tucson but to a much lesser extent. The increase in FMR rent for a two-bedroom during that time was 15.5%.
Time will tell if rent prices continue to increase. The market for home purchases has continued to be red hot through the first half of 2021; if it continues, it may put upward pressure on rents. Another important factor driving both purchase and rental prices is that housing inventory remains extremely low. Also at the forefront of many analysts’ minds is what will happen when the moratorium on evictions expires. The MAP Dashboard will continue to track housing prices, rents, inventory, and evictions as new data are released.


