 Examine Statistics on Physical Well-Being in Tucson, Arizona MSA
How are we doing?
Percent of the Population Who Reported Good or Excellent Health (2022)

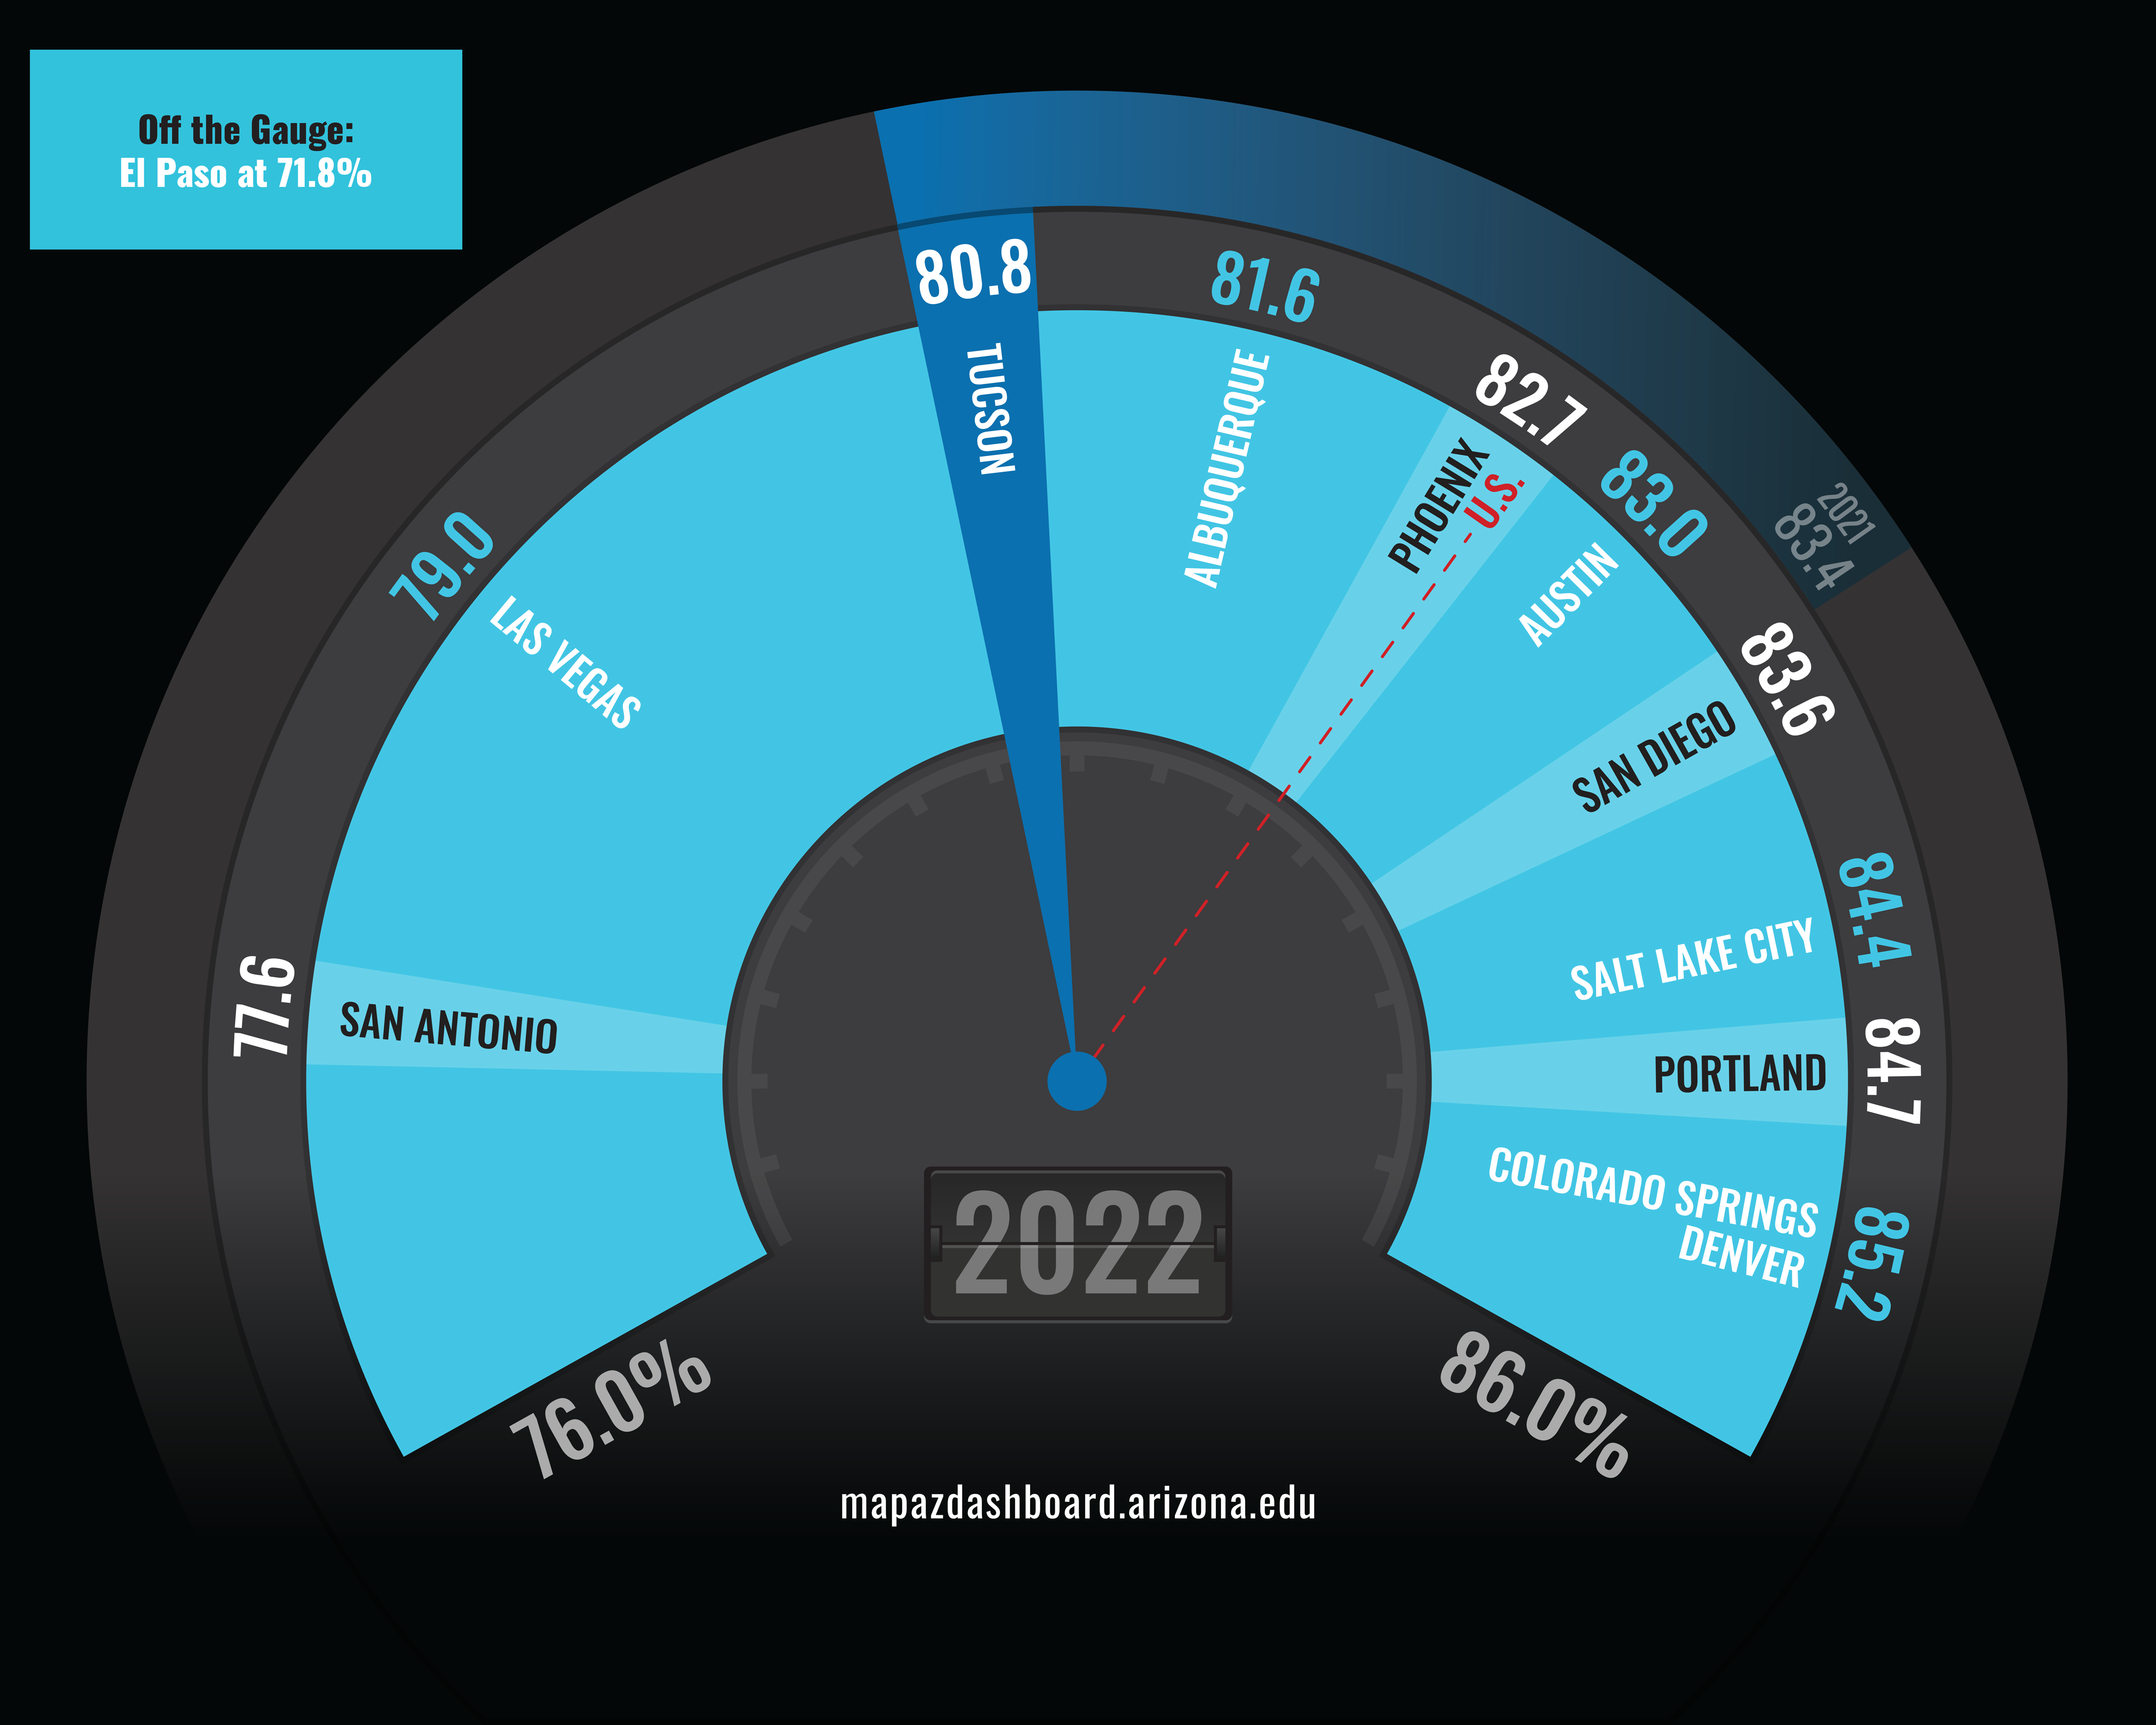
In 2022, 80.8% of the Tucson Metropolitan Statistical Areas (MSA) population reported good or excellent health. That ranked Tucson ninth among peer western communities and was well below the national rate. Denver and Colorado Springs ranked first with 85.2% of the population reporting good or excellent health, while El Paso’s rate of 71.8% placed it last and off the gauge. Tucson’s percentage of the population that reported good or excellent health decreased by more than two percentage points from the previous year and is more consistent with rates reported prior to the pandemic.
Why is it important?
Many factors determine one’s health and well-being. An individual’s health plays an important role in their quality of life. Additionally, diseases like diabetes, heart disease, and obesity have high financial costs for the nation. According to the Centers for Disease Control (CDC) heart disease is the leading cause of death in the U.S. Regular physical activity plays an important role in the prevention of many health-related diseases including heart disease. The U.S. Department of Health and Human Services defines regular physical activity as participation in moderate and vigorous physical activities as well as muscle-strengthening activities. According to data collected in 2015 for the Behavioral Risk Factor Surveillance System (BRFSS) nearly 80% of adults in the U.S. do not meet the guidelines for both aerobic and muscle-strengthening activities. Health data is vital to identify emerging health problems and trends. Additionally, health data can be used to identify areas where public health policies may be needed and to evaluate existing programs.
How do we compare?
Residents living in the Tucson MSA reported an average of 4.4 poor physical health days per month. Tucson was tied with Albuquerque and San Antonio for 8th among peer western metropolitan areas. Those living in Austin reported the least number of poor physical health days during 2022 at 3.6 per month, while residents who live in Las Vegas reported the highest number of poor physical health days at 5.0.
In 2021, the reported incidence of heart conditions, both heart attacks and coronary heart disease, in the state of Arizona were comparable to the nation. The latest data available for Tucson from the BRFSS is from 2012 when the reported rate for heart attacks was 3.3% and coronary heart disease was 3.9%.
In 2022, Tucson had an obesity prevalence of 32.8% among adults. Tucson was tied with Las Vegas for the fifth-highest rate among peer MSAs. San Diego residents posted the lowest rate at 25.4% followed by Denver at 25.9%. The state of Texas had two metropolitan areas with high rates of obesity when compared to other peer communities in the West. El Paso had the highest rate among all the metropolitan areas at 39.3% and San Antonio had the second-highest rate at 37.7%.
The percentage of the population who had a diagnosed prevalence of diabetes in 2022 ranged from 7.8% in Denver to 16.0% in El Paso. Tucson’s rate of 10.3% ranked it seventh among peers and was tied with Las Vegas.
What are the key trends?
In 2022, the percentage of the population that reported good or excellent health in the Tucson MSA was lower than the state and nation. The percentage of residents in Tucson that report good or excellent health over the past few years has generally been near 84.0% but significantly declined between 2017 -2019. The percent of the population that reported good or excellent health in 2020 increased to the highest rate in 10 years. From 2020 to 2022, the percentage of the population indicating good or excellent health declined significantly for all geographies tracked on the MAP. The state of Arizona posted a decline of 4 percentage points, while the national rate declined by over 5 percentage points and the Tucson MSA experienced a decrease of 4.5 percentage points. The percentage of the population reporting their health as good or excellent in 2022 was consistent with the rates seen prior to the pandemic.
How is it measured?
A majority of the data reported in the Physical Well-Being indicator originates from the Behavioral Risk Factor Surveillance System (BRFSS). The BRFSS is a health-related telephone survey that collects state data about U.S. residents regarding their health-related risk behaviors, chronic health conditions, and use of preventative services. The BRFSS data presented is collected from the Centers for Disease Control and Prevention (CDC) and the County Health Rankings.


