 Analyze Gross Domestic Product (GDP) by Industry in Tucson, Arizona MSA
How are we doing?
Growth Rate of Real GDP (2024)
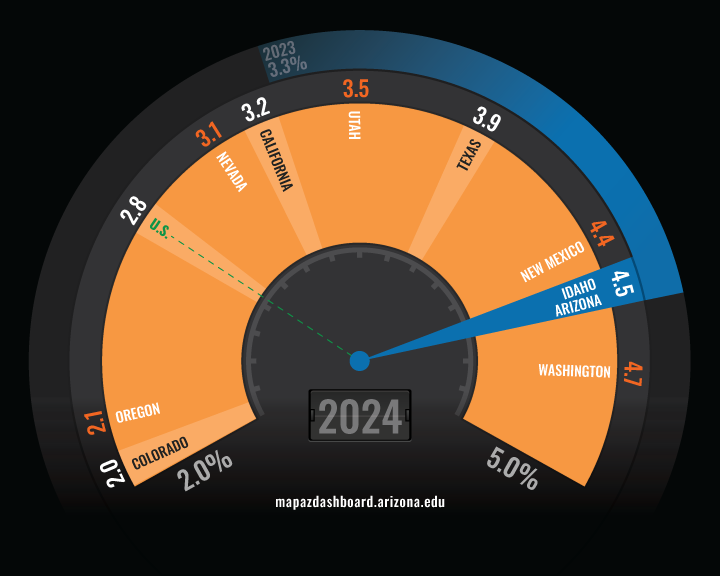
In 2024, Arizona posted inflation-adjusted Gross Domestic Product (GDP) growth of 4.5%. That was the second-fastest among western states, tied with Idaho. This was an acceleration from 2023, when Arizona’s GDP grew by 3.3%. The Bureau of Economic Analysis (BEA) no longer publishes GDP estimates for Metropolitan Statistical Areas (MSAs). However, county-level data remains available. Since the Tucson MSA and Pima County are the same geographic region, we can continue to report GDP for the Tucson MSA. Tucson’s real GDP growth in 2024 was 2.3%, slightly slower than the nation. The MAP Dashboard team is exploring methods to aggregate county-level GDP data to MSA estimates, allowing comparisons between Tucson and its peer MSAs.
GDP data help illustrate the industrial structure of an MSA. Tucson has a larger share of GDP from government activity than Arizona or the nation. This reflects the concentration of federal civilian and military installations in the area, as well as the presence of the University of Arizona, which boosted activity in the state government sector.
Why is it important?
Gross domestic product (GDP) measures the value of goods and services produced by labor and property located in a geographic area during a period of time. It is also a key measure of income flows to factors of production, such as labor and capital. After adjusting for inflation, GDP helps us understand how economic output changes over time. GDP also provides insight into a region's industrial structure by showing which sectors contribute most to economic activity. Understanding a region’s industrial structure can help explain how national and global events impact local economic growth. For example, regions with large government sectors may be more sensitive to changes in federal spending.
How do we compare?
In 2024, the financial activities sector accounted for 21.4% of Tucson’s GDP, matching the national share. Tucson’s industrial structure was more heavily concentrated in government activity than the nation, with government contributing 16.6% of Tucson’s GDP compared to 11.3% nationally. Manufacturing also accounted for a larger share of Tucson’s economy, at 14.7% of GDP, compared to 9.8% nationally.
Tucson’s larger government share reflects the region’s concentration of federal civilian and state and local government activity. Federal civilian and military activity in Tucson was roughly double the national average, as a share of GDP in 2016. The state and local government share was also higher in Tucson, reflecting the presence of major public institutions such as the University of Arizona.
What are the key trends?
The Great Recession had a significant impact on economic output in the Tucson MSA, with real GDP declining by 6.4% in 2009. That was substantially larger than the U.S. decline of 2.6% but slightly smaller than Arizona's decline of 8.2%. Tucson's real GDP growth rebounded in 2010 but generally remained near or below state and national growth rates until 2016, when Tucson's growth exceeded the national rate. Since then, Tucson has generally outpaced the nation in real GDP growth until 2022 and then again in 2024.
Tucson’s GDP contracted during the COVID-19 pandemic in 2020, but the decline was smaller than the national decline. Real GDP fell by 0.3% in Tucson, compared to 2.1% nationally. Unlike the Great Recession, the economic downturn of the pandemic was relatively short-lived. Real GDP in Tucson, Arizona, and the nation recovered quickly in 2021. Tucson posted its strongest annual GDP growth rate in nearly two decades that year. Growth slowed in 2022 before accelerating again in 2023. In 2024, Tucson's real GDP growth slowed but remained positive at 2.3%, below the national growth rate of 2.8% and Arizona's growth rate of 4.5%.
How is it measured?
Gross domestic product at the national level is measured both by spending and by income to factors of production (labor and capital). At the state level, GDP is measured using income as the only factor of production. Thus, these data provide estimates of GDP by industry, but not by the traditional spending components (consumption, investment, government, net exports). It is “gross” in the sense that it includes funds set aside to replace capital equipment that is wearing out. In other words, it includes depreciation. GDP data are produced by the U.S. Bureau of Economic Analysis and are available annually for states and counties. The BEA discontinued publication of Metropolitan Statistical Area (MSA) GDP estimates after 2023.


