 Read About Wage Distribution in Tucson, Arizona MSA
How are we doing?
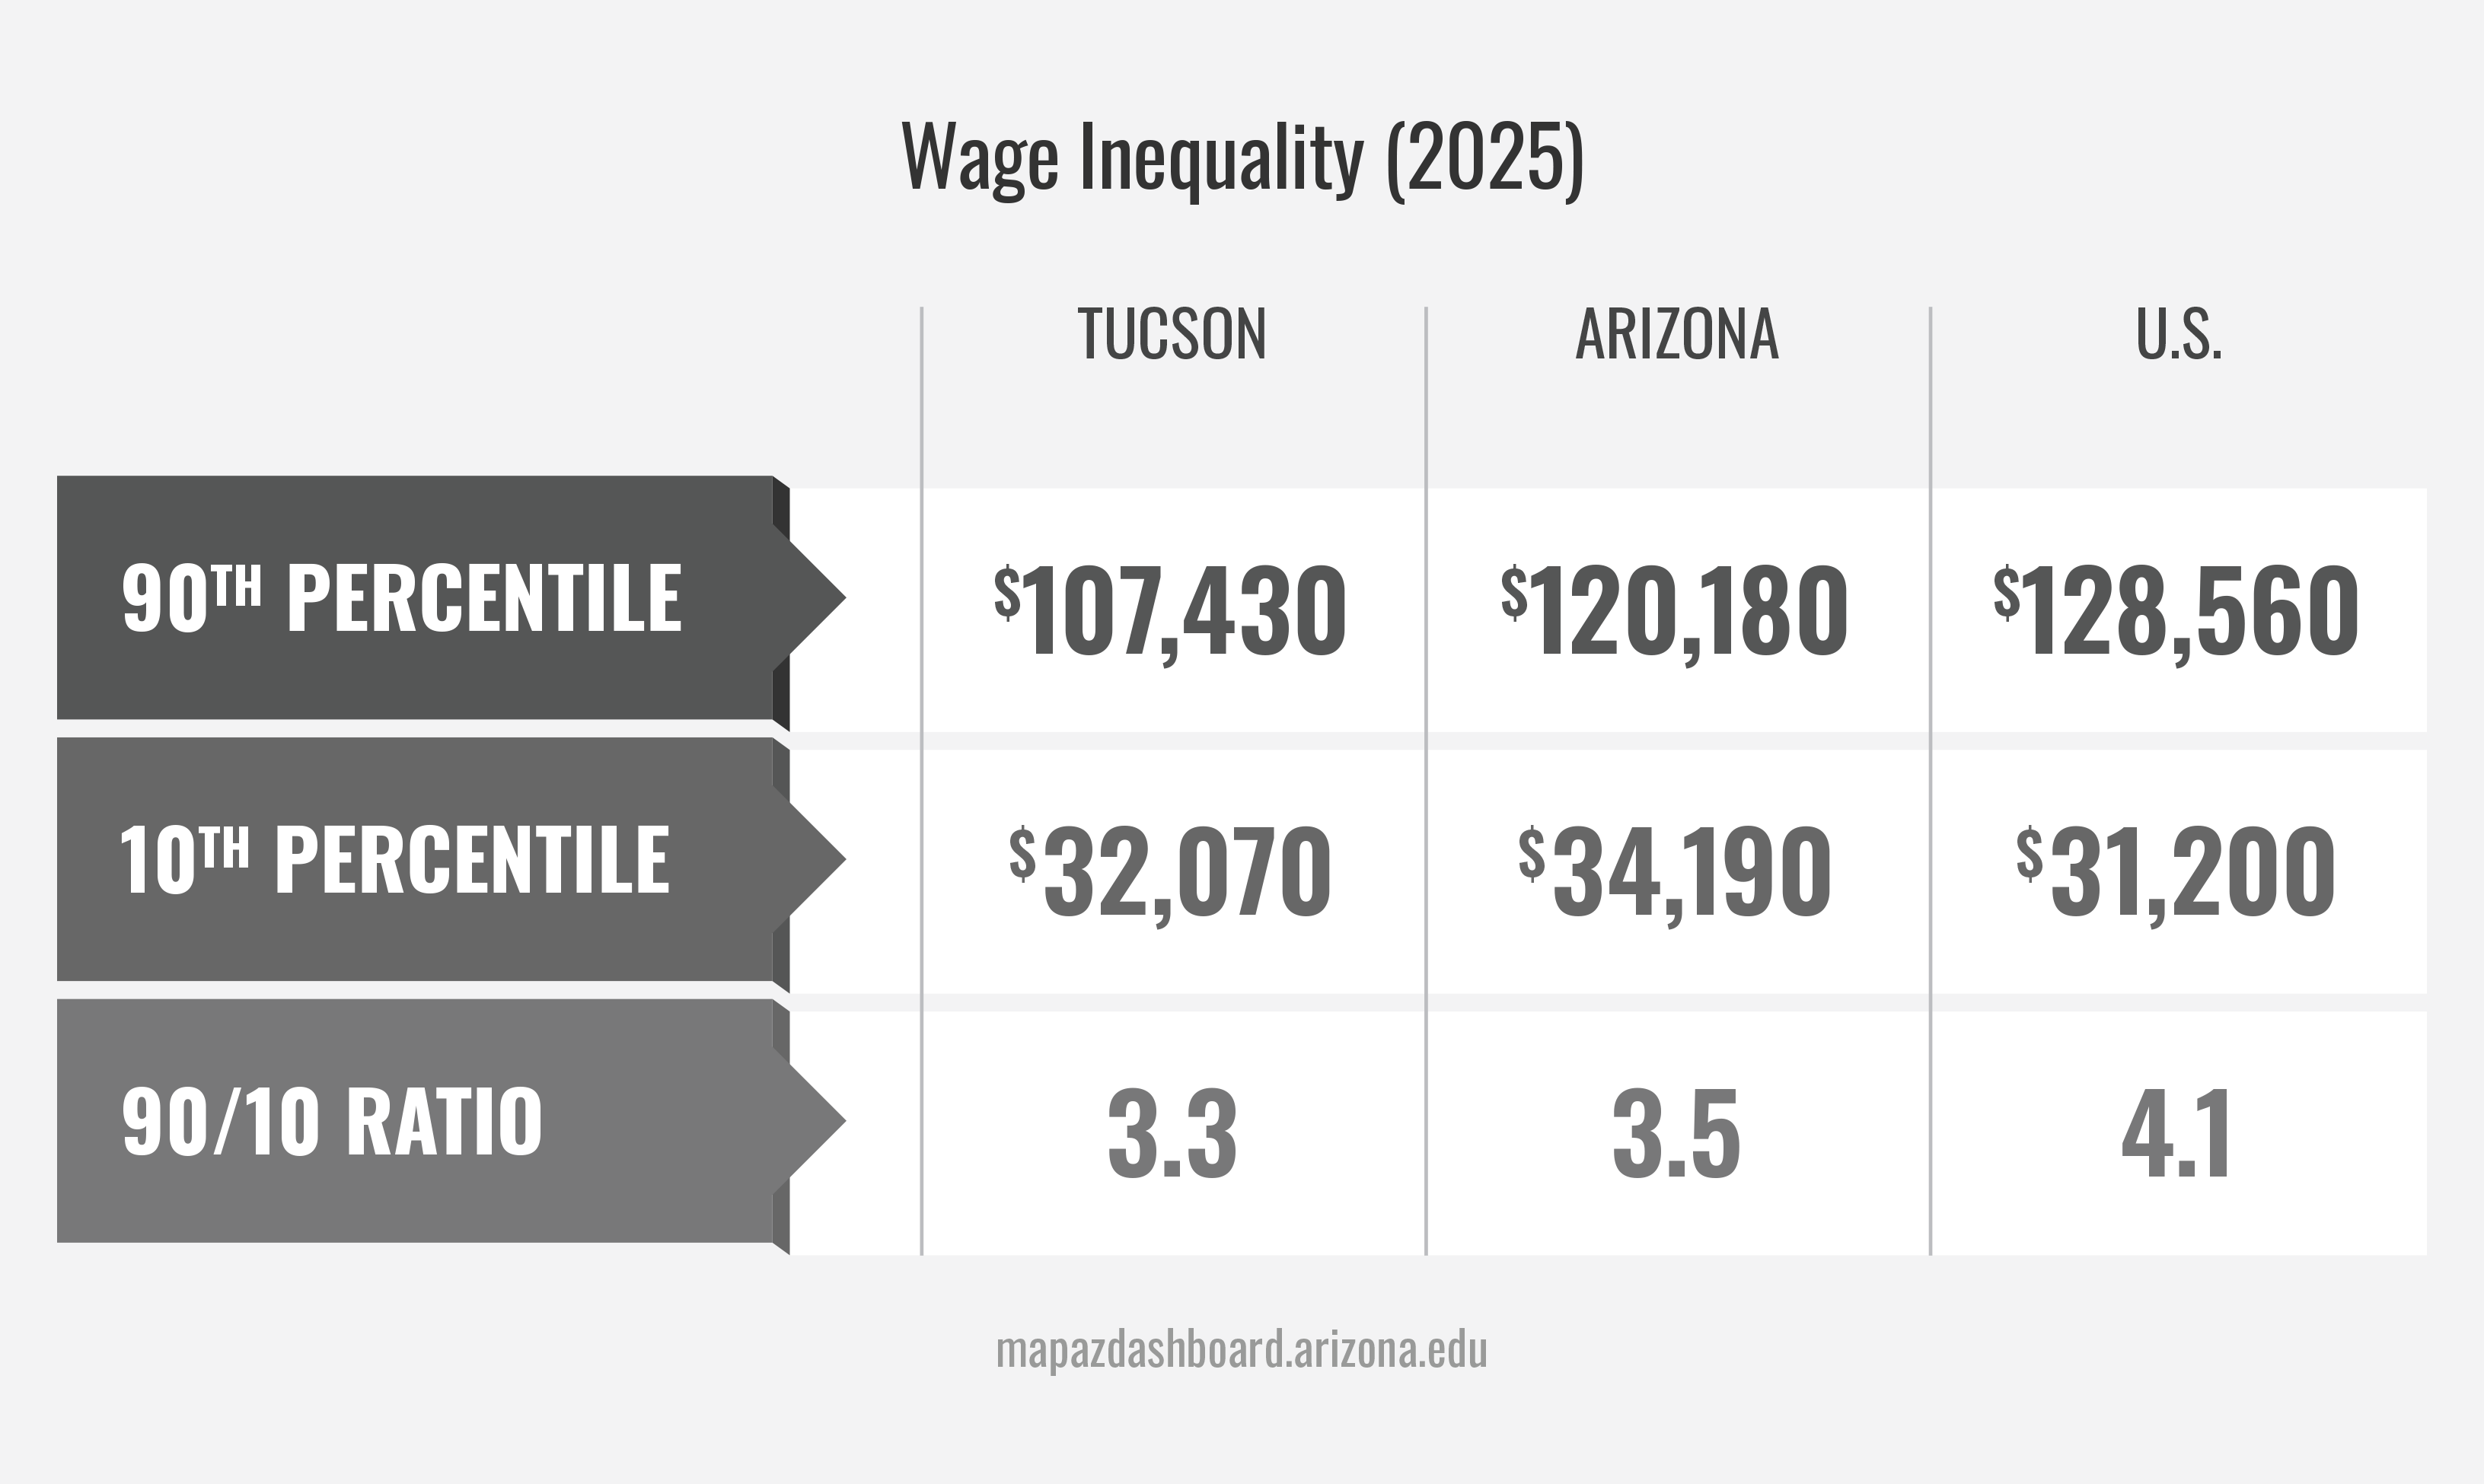
In 2025, wages in the Tucson Metropolitan Statistical Area (MSA) were below the state average at every wage level. Workers at the 10th percentile earned $32,070 annually in Tucson, compared to $34,190 statewide. However, low-wage earners in Tucson earned slightly more than the national 10th percentile wage of $31,200. At the median, Tucson workers earned $47,460, approximately $2,300 less than the state median and $3,220 less than the national median. Differences were larger among high-wage earners. Workers at the 90th percentile earned $107,430 in Tucson, compared to $128,560 nationally. In Tucson, workers at the 90th percentile earned 3.3 times as much as workers at the 10th percentile.
Why is it important?
Wages are the primary source of income for most households. Higher wages are often associated with greater economic opportunity and purchasing power. Wage levels vary across workers due to differences in education, occupation, industry, experience, and other regional characteristics. Examining wages across the distribution provides insight into how earnings vary within a region and how opportunities differ for workers at different skill and income levels. Tracking wage distributions can also help communities better understand workforce outcomes and changes in the local economy over time.
How do we compare?
The ratio between wages at the 90th percentile and the 10th percentile is commonly referred to as the 90/10 wage ratio and is one measure of wage inequality. Smaller ratios indicate less variation between high- and low-wage earners. In 2025, Tucson’s 90/10 ratio was 3.3, compared to 4.1 nationally. In Tucson, wage earners at the 90th percentile earned $107,430, compared to $32,070 at the 10th percentile.
Tucson reported the lowest wage inequality among peer western MSAs in 2025, with a 90/10 ratio of 3.3. Phoenix ranked second lowest at 3.6, while Austin reported the highest ratio at 4.6.
What are the key trends?
Wage disparities increased or remained consistent between 2001 and 2016 for the Tucson MSA, the state of Arizona, and the U.S. However, in 2017, the wage disparity, or 90/10 ratio, declined significantly in Arizona and Tucson. The decline coincided with increases in Arizona's minimum wage beginning in 2017. In 2025, Tucson's 90/10 ratio was 3.3, down from a peak of 4.6 in 2006 and slightly below the 2024 ratio of 3.5. Arizona's ratio was 3.5, while the national ratio was 4.1.
How is it measured?
The U.S. Bureau of Labor Statisticscollects wage data by occupation and industry and reports it annually in itsOccupational Employment and Wage Statistics (OEWS). The OEWS data includes detailed employment and wage data for over 800 occupations and industries. Wages are compensation received for working and do not include fringe benefits or other sources of income, such as interest, dividends, or rents. The 10th percentile represents the wage at which 10 percent of workers earn less. Likewise, the 90th percentile reflects the wage at which 90 percent of workers earn less. The median is the midpoint of the income distribution; half of wage earners are above, and half below.


