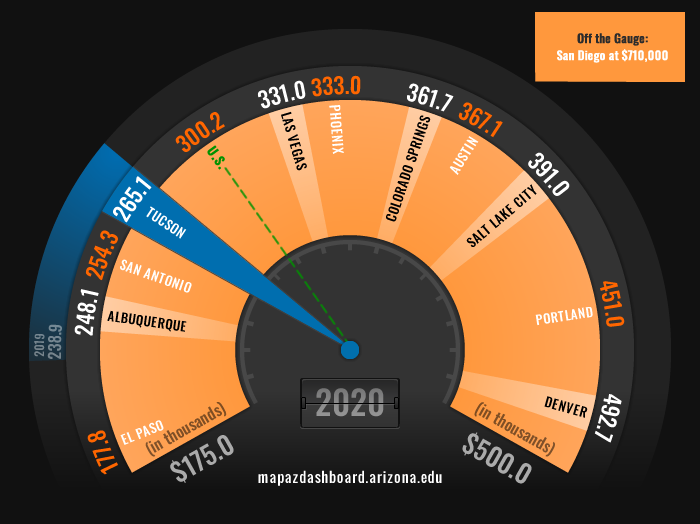
Tucson’s single-family home prices increased by 11.0% in 2020 to $265,100. That was the fourth-fastest growth among peer Metropolitan Statistical Areas (MSAs) in 2020. Despite the rapid growth in 2020, Tucson had a relatively low median home price when compared to its peers. Only three MSAs measured on the MAP reported lower single-family median home prices in 2020. El Paso posted the lowest median home price at $177,800 followed by Albuquerque and San Antonio. San Diego’s median home price in 2020 was so much higher than the other 11 MSAs tracked on the MAP that it was off the gauge at $710,000 (Figure 1). That was more than $200,000 higher than the next highest MSA, Denver, at $492,700. Home prices have steadily increased in Tucson since the Great Recession with a significant acceleration over the past two years.
Figure 1: Median Home Price (2020)
In 2020, Tucson remained the most affordable place to buy a home when compared to peer MSAs. In 2020, 74.7% of homes sold in Tucson were considered affordable for a family earning the local median income. That ranked Tucson first among peers, just ahead of Albuquerque. Nationally 64.2% of homes in the U.S. were affordable. The median home price in many MSAs across the West is rising at a fast pace. However, wages are also rising, thus sustaining affordability for those earning at least the median family income.
While housing in Tucson remained relatively affordable through 2020, data for the first quarter of 2021 suggested that it may be declining (Figure 2). In the first quarter of 2021 housing affordability in Tucson declined to 70.2%, nearly a five percentage point decline from 2020. While housing affordability fell in many of the western MSAs tracked on the MAP in the first quarter of 2021 Tucson posted the second-largest decline when compared to the fourth quarter of 2020.
Figure 2: Housing Affordability Quarterly
Tucson might be affordable for someone earning the local median household income but that is not the case for those in the lower-income range. Of the households in Tucson that earn less than $20,000, 42.1% of them pay more than 30% of their income in housing costs (Figure 3). For those in the $20,000 - $34,999 income bracket, the housing cost-burdened rate was 30.1%. Households that pay more than 30% of their income in housing costs are considered housing cost-burdened, meaning they are more likely to struggle to pay for other basic needs such as healthcare, childcare, transportation, and even food.
Figure 3: Housing Cost Burden by Income (2019)
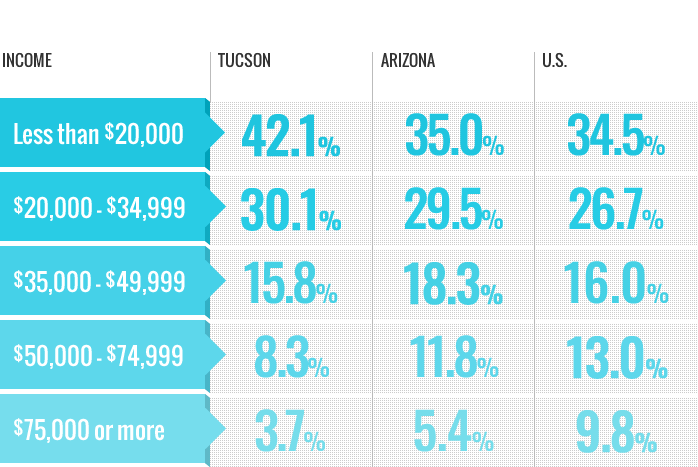
Tucson is also relatively expensive for rentals when compared to the nation. According to RentData.org rent prices are above the national average, with a two-bedroom rental costing $959 in 2021. Additionally, 51.0% of renters in 2019 were considered housing cost-burdened, paying more than 30% of their income in rental and utility costs. While Tucson continues to be affordable for those earning the local median family income or higher, more affordable options for those in the lower-income brackets is one key area the region needs to address. As illustrated in Figure 3, a higher share of lower-income households are considered housing cost-burdened in Tucson when compared to the state and the nation.
The decline in housing affordability seen in the first quarter of 2021 may continue if home prices rise faster than wages. In 2020, home prices in the Tucson MSA increased by 11%. That was the fastest growth in home prices in seven years. Tucson’s growth in home prices was on par with peer western MSAs with Denver posting the slowest growth at 6.6% and Phoenix the fastest growth at 16.0%. Historically, the growth in home prices has fluctuated significantly with the fastest growth of 30.6% over the past twenty years happening just prior to the housing crisis in 2005. Tucson saw significant declines in home prices during the housing crisis with prices falling by 45.1% between 2006 and 2011 (Figure 4). In 2020, home prices in Tucson finally peaked above their pre-housing crisis price at $265,100.
Figure 4: Median Home Price
One factor driving increasing home prices includes reduced supply. The inventory of available homes was down 61.9% over the year in May of 2021, according to data from the Multiple Listing Service. Further information on the number of active listings can be found on Arizona's Economy website. Another factor that may be contributing to increasing prices is the migration from metropolitan areas where prices are significantly higher, like San Diego and Denver. To read more about where Arizona draws the most migrants check out the article: Destination Arizona: Where are People Moving From? And Why?
Stay tuned to the MAP Dashboard for an upcoming article on how Tucson's rental prices compare to other peer metropolitan areas.


