Overview
This third phase of the Housing Study builds on the previous phases to look at gaps in our housing market and identify the groups and households that are not as well served by our market. This gap analysis points to needs for housing to better serve different populations and income levels. The study first looks at overall population and household trends and income levels, and then focuses on Older Adults, Housing by Ethnicity, Housing by Race, and Neighborhood Vulnerability Index Comparisons.
One of the fundamental drivers of housing demand in the Tucson region is population, and local incomes, discussed below.
Population Growth
Since the year 1990, the population of the Tucson MSA has grown about 56%, adding just under 376,000 people to the community.
In addition to population, the number of new households is a key driver for housing demand. Average household size in the Tucson MSA remains steady at 2.42 in 1990, 2.47 in 2000, and 2.46 in 2010 (from corresponding Decennial Census data). The chart below shows the number of new households in the Tucson MSA for each of the past three decades, compared to new housing. Housing development was keeping pace with and even exceeded new household creation from 1990-2008. However, since the Great Recession we have seen a slowdown in housing production which has not recovered to previous levels. This makes it challenging for some households – both newcomers and current residents – to find affordable housing. According to the Arizona Multihousing Association, as population growth continues, more housing units will need to be built "to meet demand and control the cost of housing".
Income and Affordability
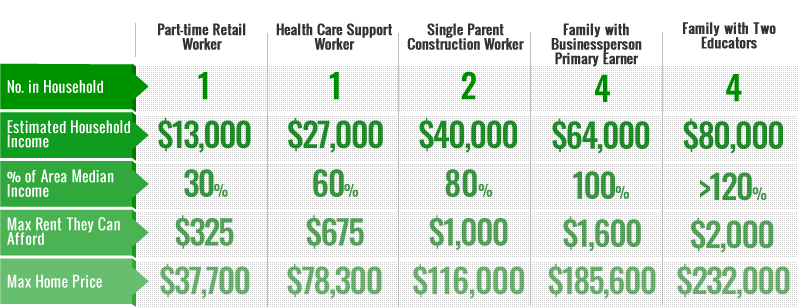
The U.S. Department of Housing and Urban Development defines affordable housing as: “Housing in which the occupant(s) is/are paying no more than 30% of his or her income for gross housing costs, including utilities.” The graphic below illustrates what affordable housing looks like for a few of the common occupations in the Tucson MSA, with varying family size.
Rental Affordability
The graph below compares actual rental household income levels (from the 2018 5-year ACS) to the number of rental households that are housing cost burdened in each income category. The graph shows that there is a considerable lack of affordable rental housing for households making less than $20,000 per year in the Tucson MSA, with about 93% of those households spending more than 30% of household income on housing costs. For a household made up of two people with this income, the maximum rent for a 1-bedroom unit to remain affordable would be $500. This rent level is difficult to find on the market and usually requires a voucher or subsidy program. These low-income households extend themselves financially to rent more expensive housing units.
Rental Unit Distribution by Income
The figure below illustrates the complexity of finding affordable rental units for the existing population in the Tucson MSA. While the data suggests that there is sufficient housing supply in the region, it also suggests that there are not enough affordable units available for households with the lowest annual incomes. The diagram shows all rental households in the Tucson MSA, grouped by household income, and an educated estimation of how households in each income range meet their housing need.
For example, the almost 40,000 rental households with less than $20,000 in annual income likely inhabit the small number or rental units available at less than $500/month, a share of informal rental units and multifamily units* with unknown rent, with the majority of households left renting in the $500-$875/month range, causing these households to be housing cost burdened. At the other end of the spectrum, the approximately 22,000 rental households with more than $75,000 in annual income likely inhabit available units at a variety of rental prices from $875/month all the way up to more than $1875/month. However, virtually all rental housing options are available to these higher income households with very low risk of becoming housing cost burdened. (*Multifamily units include apartment complexes and mobile home parks where the homes are not owned by residents.)
Note: scroll over the nodes and links in the diagram for pop-up details.
This figure is a representation of one model for how Tucson's renter households are sorted in our housing market. Several assumptions were made to develop this model:
- The total number of informal rental units is assumed as the difference between known units and the number of rental households. This includes Accessory Dwelling Units (ADUs), some mobile homes, and single family homes not declared as rental units in public records.
- Informal rental arrangements and market rate units with unknown rents were divided equally across all income ranges because any amount of rent is possible.
- Single family homes declared as rental units in public records were divided equally between the two highest income ranges because rents are assumed to be higher.
The dynamic shown here is consistent with the latest findings of the National Low Income Housing Coalition (NLHIC), which finds a shortage of affordable and available rental homes for extremely low-income renters.
Homeownership Affordability
The income comparison for owner-occupied housing units tells a different story. Most households in the highest income levels are not occupying units that stretch the household financially; less than 50% of owner-occupied households are housing cost burdened at the $20,000-$35,000 annual income range while almost 75% are burdened when the household earns less than $20,000 in a year. There may be several reasons for this: 1. the highest income households might not hold a mortgage on the property and thus pay very low monthly occupancy costs, 2. higher income households are buying units far below their means and are crowding out affordable owner-occupied housing for lower income levels, or 3. while lower income households may appear to have affordable owner-occupied housing available to them, there are other financial reasons they cannot afford to buy an otherwise affordable home.


