Housing affordability in the Tucson Metropolitan Statistical Area (MSA) was the highest among western peer metros at 74.7% in 2020. That means nearly 75% of single-family homes sold in 2020 were affordable to someone earning the local median family income. Will Tucson remain affordable as the housing market booms? Early data suggests that Tucson, along with peer MSAs across the West, will see significant declines in housing affordability.
Housing affordability measures are primarily made up of two factors: home prices and local family income. Home prices have skyrocketed in the Tucson MSA over the past two years. The median price of a single-family home in 2020 was up 11.0% and the monthly data suggests we will see an even larger increase year-over-year for 2021. While home prices have shot up rapidly, incomes have not kept pace, which can create an affordability problem. For reference, the median family income in the Tucson MSA for the most recently available data (2019) was $72,920. It is important to note that family income is typically higher than household income. This is a particularly important distinction for Tucson given the high percentage of retirees and college-age students.
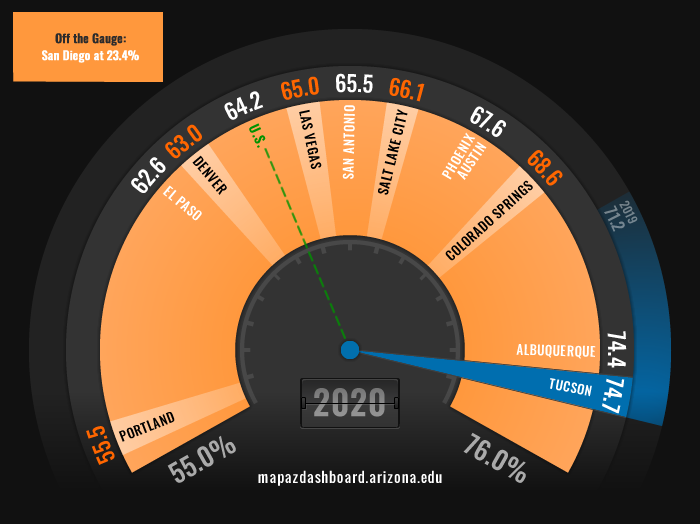
Tucson has held steady as one of the most affordable regions when compared to western peers over the past several years. In 2020, Tucson ranked first in the percent of single-family homes sold that were affordable to someone earning the local median family income. San Diego was the only MSA where less than 50% of recently sold single-family homes were considered affordable. Figure 1 illustrates the percentage of recently sold single-family homes that were affordable to someone earning the local median family income for their region.
Figure 1: Housing Affordability in 2020
Booming home prices and slowly rising income levels across the U.S. will impact housing affordability significantly. The decline in affordability is already evident when exploring the quarterly data (Figure 2). Housing affordability fell substantially in Tucson from 74.0% in the third quarter of 2020 to 64.8% in the third quarter of 2021. Tucson’s housing affordability is the lowest it has ever been since the MAP Dashboard began tracking the data in 2012. During this same period, the Phoenix MSA posted a decline in affordability from 66.6% to 51.2%.
Figure 2: Quarterly Housing Affordability
Housing affordability declined among all MSAs tracked on the MAP Dashboard between the third quarter of 2020 and the third quarter of 2021, as illustrated in Figure 3. The substantial decline in housing affordability can be attributed to home prices rising faster than local area income. Colorado Springs posted the largest decline in housing affordability with an 18.5 percentage point drop, while Phoenix followed closely behind. Tucson’s decline in affordability fell in the middle of peer MSAs, while San Antonio posted the smallest decline. Nationally housing affordability declined by 6.7percentage points during this period.
Figure 3: Decline in Housing Affordability from 2020Q3 to 2021Q3
Housing affordability is calculated by two primary factors: home prices and income. Therefore, it is important to track changes in these factors to provide insight into the underlying driving force of affordability.
In 2020, single-family home prices in the Tucson MSA increased by 11.0%. That was the fourth-fastest growth rate when compared to peer MSAs. Phoenix’s home prices grew even faster at 16.0%. Home prices in the Denver MSA grew the slowest at 6.6%.
Recent data from the Tucson Association of Realtors shows that prices are up even more in 2021. The latest data available for October shows a 20.1% increase in the median sales price of a single-family home when compared to October of the prior year. Further, the data shows a 22.6% increase in the median home price year-to-date in 2021.
Factors driving home prices upward include increased demand as the state’s population rises and cost pressures resulting from reduced housing inventory, labor shortages, and rapidly rising construction input prices.
Figure 4: Growth Rate in Median Home Price (2020)
Trends in family income also have a big impact on housing affordability. According to the income and poverty report released by the Census Bureau, median family income nationwide declined by 3.2% between 2019 and 2020. With rapid gains in employee compensation in the second half of 2021, we may see some improvement in income growth this year. However, housing affordability will continue to decline if home prices continue to outpace income.
Further, Tucsonans in lower-income brackets already face challenges finding affordable housing as discussed in the recent article “Strong Growth in Tucson’s Housing Market” and the “Tucson Housing Market Study”. Declining affordability may soon impact those in the higher income brackets as well.
Stay tuned to the MAP Dashboard for updated housing affordability and home prices as the annual data becomes available. To explore some of the factors driving the steep rise in home prices, such as historically low inventory, visit Arizona’s Economy.


