 The Latest Labor Market Information in Tucson, Arizona MSA
This page provides an update on Tucson's labor market recovery, as well as key labor market characteristics. The more detailed articles will be updated in the following weeks. To review the data as of April, 2022 click the two links below to dig deeper.
The pandemic delivered a huge shock to the Tucson labor market, which lost 45,500 jobs from February to April 2020. As of April 2022, Tucson has added back 40,200 of those jobs for a replacement rate of 88.4% (Figure 1). That was below the replacement rate for the nation, the state, and all metropolitan areas in Arizona except Sierra Vista. When compared to peer metros in the West, Tucson’s job recovery rate also falls at the bottom of the pack. Job recovery has varied across industries in Tucson with professional and business services, government, and leisure and hospitality the slowest to recover. In contrast, the trade, transportation, and utilities industry had gained over 7,500 jobs over their pre-pandemic peak.
Figure 1: Arizona Job Replacement Rates, Seasonally Adjusted
| Area | Jobs Lost, Feb-Apr 2020, Thous. | Jobs Gained, April 2020 - April 2022, Thous. | Replacement Rate, April 2022 (%) |
|---|---|---|---|
| Flagstaff | -12.8 | 11.8 | 92.2% |
| Lake Havasu City-Kingman | -6.1 | 8.3 | 136.1% |
| Phoenix | -249.7 | 293.6 | 117.6% |
| Prescott | -8.9 | 10.4 | 116.9% |
| Sierra Vista- Douglas | -2.2 | 1.4 | 63.6% |
| Tucson | -45.5 | 40.2 | 88.4% |
| Yuma | -5.9 | 6.4 | 108.5% |
| Arizona | -338.7 | 387.4 | 114.4% |
| U.S. | -21,991.0 | 20,779.0 | 94.5% |
Tucson’s employment mix is similar to the U.S. and state with a few notable exceptions. The share of jobs in government in Tucson was substantially higher given the presence of local military bases and the University of Arizona whose employees are included in state government. Tucson had much smaller shares of employment in manufacturing and the trade, transportation, and utilities industry when compared to the nation. Tucson’s total nonfarm employment grew by 1.6% in 2021. That was a significant improvement over the 4.5% decline in 2020 due to jobs lost during the pandemic. However, that growth paled in comparison to the nation and most peer western metros.
Just as the nation posted strong employment growth between 2020 and 2021, the median occupational wage also showed strong growth, increasing by over nine percent. Tucsonans in the labor market were not so fortunate with wages declining by just over 2%. Statewide the median occupational wage also declined. The food preparation and serving occupation however posted strong wage growth at more than 10% nationally, statewide, and in Tucson.
Tucson, and the nation, have posted low unemployment rates over the past year. As of April 2022, Tucson’s unemployment rate was 2.9%, which was below the state rate (3.2%) and the nation at 3.6% (Figure 2). The unemployment rate declines for two primary reasons: unemployed residents find jobs or the unemployed drop out of the labor force, perhaps because they are discouraged. Overall, Tucson’s unemployment rate has dropped primarily because unemployed residents have become employed.
Figure 2: Tucson MSA, Arizona, and U.S. Unemployment Rates, Seasonally Adjusted, Percent
The employment-to-population ratio is another way to measure labor market performance. These data divide household employment by the non-institutionalized population aged 16 and over. As of April 2022, the employment-to-population ratio for the state of Arizona and the nation had nearly recovered to pre-pandemic levels suggesting a relatively tight labor market. Unfortunately, monthly data for Tucson are not available.
While the unemployment rate and employment-to-population levels have improved drastically since the beginning of the pandemic that is not the case for the labor force participation rate. Exploring monthly data for Arizona and the nation, the state labor force participation rate remains well below its pre-pandemic level as of April 2022 (Figure 3). Monthly data are not available for Tucson. The labor force participation rate is the ratio of the labor force (employed and unemployed residents) divided by the non-institutionalized population aged 16 and older.
Figure 3: Arizona and U.S. Labor Force Participation Rate, Seasonally Adjusted, Percent
The labor force participation rate data available for Tucson is annual and reflects a five-year survey period. The most recent data from 2020 for the working-age population (25-54) placed Tucson in 11th among peer western metros with a rate of 80.1%. This was consistent with labor force participation rates reported in 2019. Due to the five-year survey period which consisted of data from 2016 to 2020 recent trends in Tucson’s labor force market may not yet be reflected in the data. Therefore, exploring the more recent statewide data allows a glimpse into what may be happening in Tucson.
Arizona’s labor force age 16 and older declined sharply during the early portion of the pandemic, then rebounded at a fairly rapid pace, but has shown a marked slowing recently. This has caused the state labor force participation rate to drop from 61.3% in June 2021 to 60.8% in April 2022, in contrast to continued improvement nationally. Individuals leave the labor market for a variety of reasons such as retirement, the need to care for a family member or child, illness, or simply stop seeking employment.
A recent trend discussed widely in the media is the Great Resignation. This refers in part to the higher than normal quit rate that occurred during the pandemic and has continued. In March 2022, 137,000 people in Arizona quit their job (Figure 4). At the same time, job openings have skyrocketed to 247,000 and hiring remains solid. The combination of increased quit rates and solid hiring rates reflects individuals reassessing their labor market options and moving across firms, occupations, and/or industries. The data on quits does not include retirements.
Figure 4: Arizona and U.S. Quit Rates, Twelve-Month Moving Average, Seasonally Adjusted, Percent
So why has the state labor force participation rate weakened recently? We may have seen an increase in retirements. The share of the population not in the labor market due to retirement has risen significantly according to national data from the St. Louis Federal Reserve Bank. Another factor driving down the labor force during the pandemic was the number of individuals who left the labor market to take care of the home and family during the pandemic.
One source of labor force growth that was clearly impacted by the pandemic and the policies of the prior administration was international migration. According to data from the Census Bureau, as of mid-2021, the decline in net international migration had yet to turn around.
In addition, labor force participation rates vary significantly by level of education. Those with a college degree have rates over 70% while those with less than a high school degree have participation rates near 45%. During the pandemic, the labor force participation rate declined for all individuals regardless of their level of education as illustrated in Figure 5. However, the declines were felt the most in those with a high school degree or some college.
Figure 5: U.S. Labor Force Participation Rate by Educational Attainment Level, 25 years of age and older (12-month average)
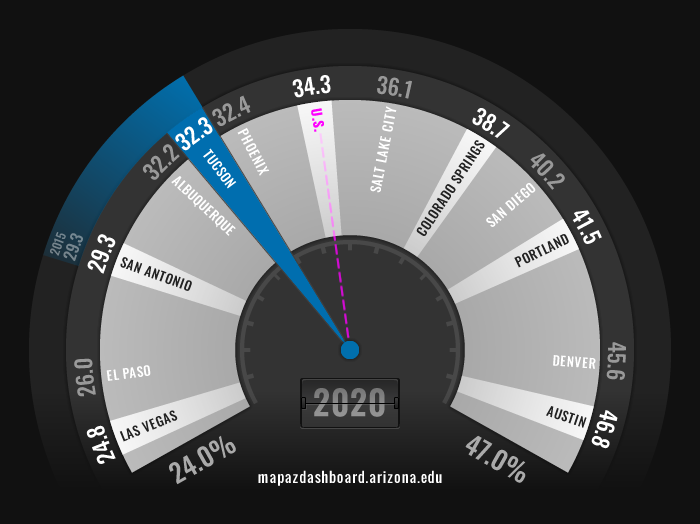
A highly educated workforce is important for a variety of reasons including higher labor force participation rates, strong employment growth, reduced crimes rates, lower poverty, and higher wages for those with all levels of education. Tucson’s college attainment rate for the working-age population was 32.3%, well below the nation (Figure 6). Over the past twenty years, the U.S. college attainment rate for the working-age has increased at a rate nearly double that of Tucson’s.
Figure 6: Four-Year College Attainment Rate for the Working Age Population (2020)
The pandemic spurred an increase in automation, especially in face-to-face jobs. Additionally, e-commerce retail sales surged during the pandemic. Increased automation will impact the Tucson labor market. According to a 2019 study released by the Economic and Business Research Center, 154,000 local jobs are at high risk of automation in the coming decades. That translates into 42.4% of all local jobs.
To learn more about the structure of Tucson's labor market check out the article on Tucson's Structure. To view current labor force trends in Arizona and Tucson read the article on Detailed Analysis of Tucson's Pandemic Recovery.


