In 2021, the employment mix by industry across the Tucson Metropolitan Statistical Area (MSA) was similar to the state of Arizona and the U.S. A few notable differences were the share of jobs in manufacturing; government; and trade, transportation, and utilities. Government jobs account for 19.1% of Tucson’s employment, whereas the share of government jobs statewide and nationally was much lower. The government sector includes federal civilian, state, and local government jobs. University of Arizona employees are included in state government. Tucson has a large military presence due to local military bases. The percentage of military employment in Tucson is nearly double that of the state or nation. In 2021, the nation had significantly higher levels of employment in manufacturing jobs as well as in trade, transportation, and utilities compared to Tucson. Figure 1 highlights the share of employment in Tucson by industry. Click on the drop-down menu to view Arizona or the U.S.
Figure 1: Employment by Industry (2021)
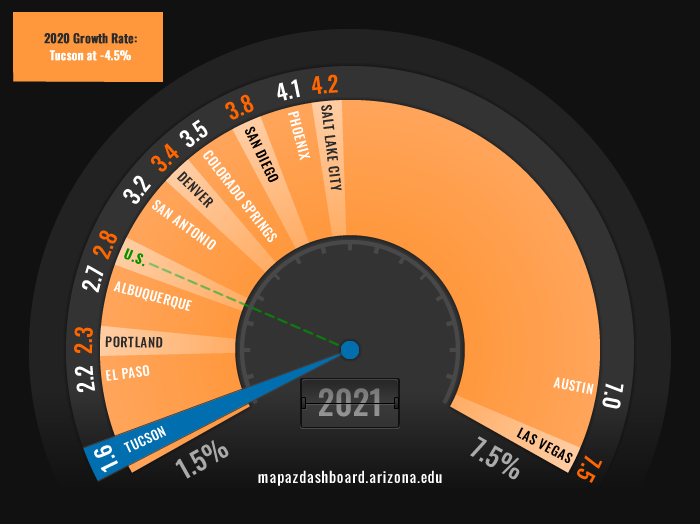
Tucson’s total nonfarm employment grew by 1.6% in 2021 (Figure 4). That was a significant improvement from the decline of 4.5% in 2020 due to jobs lost during the pandemic. Nationally jobs increased by 2.8% and statewide by 3.6%. While Tucson’s job gains were slow and fell at the bottom of peer western MSAs the recovery has begun.
Figure 4: Growth Rate of Total NonFarm Employment (2021)
While Tucson’s employment mix differs from the nation, so does its wage distribution among occupations. In Tucson, those in the architecture and engineering occupation earned the highest wage at $94,240. That was significantly higher than their national peers at $79,840. The highest median wage by major occupation for the U.S. was in management at $102,450. The management occupation in Tucson had a median wage of $79,840, more than $20,000 lower than the nation. The occupation with the lowest median wage for both Tucson and the nation was food preparation and serving related.
The overall median wage for all occupations in 2021 was $38,050 for Tucson (Figure 5). That was significantly below the nation ($45,760) and slightly below the state ($39,500). Wages in Tucson and Arizona decreased between 2020 and 2021, while nationally they increased by 9.1%.
Figure 5: Median Wage for All Occupations (2021)
The labor force participation rate is an important gauge of the health and potential output of the economy. As the economy expands, typically more individuals enter the labor force – a measure including both employed persons and the unemployed who are actively seeking employment.
The demographics of a region can affect this measure significantly. For example, a region with a higher percentage of adults in their prime working years will often have higher labor force participation rates. These regions typically have the potential for greater economic growth. Tucson has a smaller share of the population between 20 and 64 years old than the nation (Figure 6). Tucson’s share of the population 65 years and older (those typically not in the workforce) is the highest among peers and nearly five percentage points above the U.S.
Figure 6: Population by Age (2019)
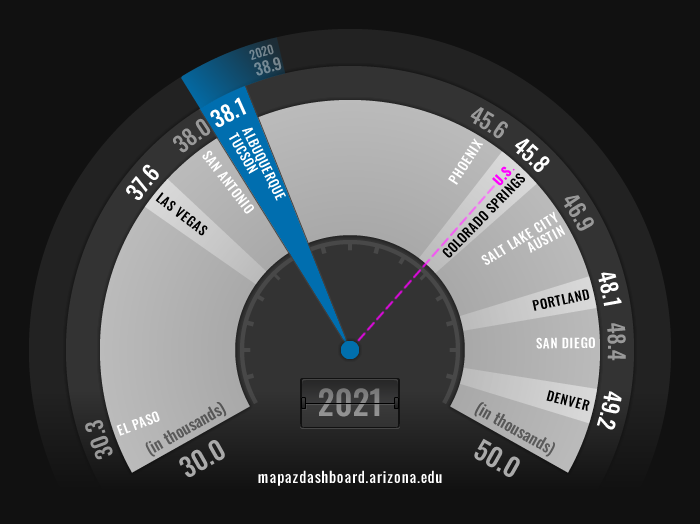
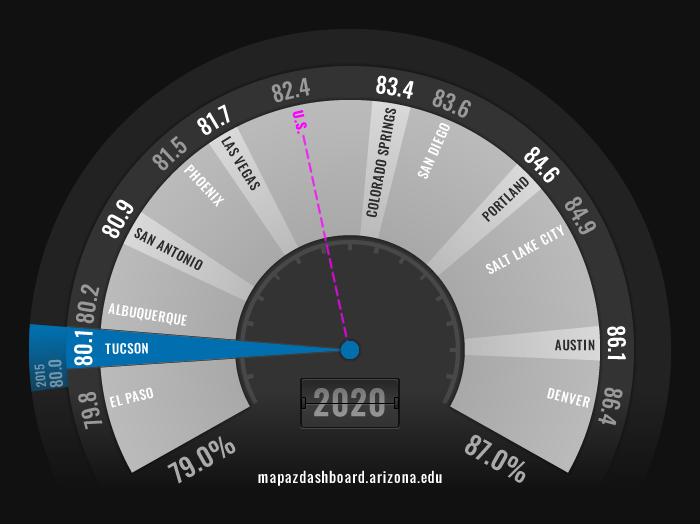
To reduce the influence of different demographic structures on the labor force participation rate, we focus on the prime-age rate, which includes residents age 25-54. In 2020, the labor force participation rate for the prime working-age population in Tucson was 80.1%. That ranked Tucson 11th among peer western MSAs, above only El Paso (Figure 7). Overall, Arizona’s metro areas rank low among the 12 western MSAs, with Phoenix (81.5%) in eighth. Out of the 12 western MSAs tracked on the MAP, the six lowest labor force participation rates among adults in their prime working-age were located in the Southwest.
Figure 7: Labor Force Participation Rate Among Ages 25-54 (2020)
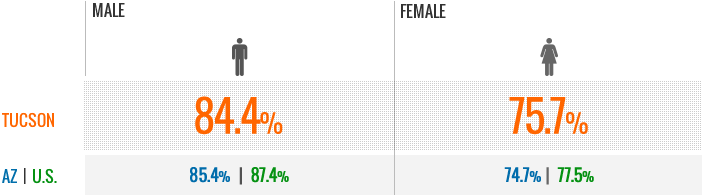
When comparing the labor force participation rate by gender for the prime working-age we find that male and female participation lagged behind the nation by several percentage points, as illustrated in Figure 8. The national labor force participation rate among adults in their prime working years reflects a higher level of engagement in the labor market across the nation when compared to Tucson.
Figure 8:Labor Force Participation Rate by Gender (2020)
Data from the current population survey published by the Bureau of Labor Statistics shows a clear relationship between labor force participation rates and educational attainment levels. Nationally, those with a bachelor’s degree or higher have historically had labor force participation rates above 70%, while those without a high school diploma have a rate near 45%. As illustrated in Figure 9, the higher the educational attainment level, the higher the labor force participation rate.
Figure 9 also highlights a common theme recently discussed in the media about overall declining labor force participation rates and the Great Resignation. Since the beginning of the pandemic, the labor force participation rate for those with a bachelor’s degree or higher declined by 2.2%, those with an associate degree posted a slightly larger drop of 3.2%, while the labor force participation rates of those with a high school degree declined the most at 4.4%. Those with less than a high school degree posted a decline in their labor force participation rate of 2.4%. That resulted in a loss of nearly 2 million individuals aged 25 and older who were participating in the labor force in 2021 compared to 2019.
Figure 9: U.S. Labor Force Participation Rate by Educational Attainment Level, 25 years of age and older (12-month average)
Regions with a higher concentration of highly educated residents tend to not only have higher levels of labor force participation rates but they perform better across many socioeconomic indicators, including the crime rate, poverty, productivity, and unemployment. Additionally, less educated residents often earn higher wages in regions with a larger concentration of college graduates as wages overall tend to increase.
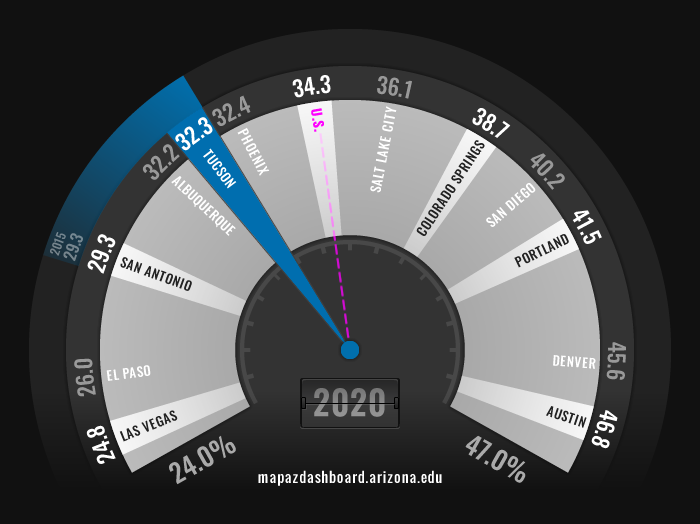
In 2020, 32.3% of the working-age population had a four-year degree or better in Tucson. That ranked Tucson eighth out of 11 peer MSAs and behind the nation as illustrated in Figure 10. Tucson’s four-year college attainment rate over the last twenty years for the working-age population has increased at a pace much slower than the nation. Increasing by only 4.7 percentage points since 2000 in Tucson, while the nation has almost doubled that with an increase of 7.8 percentage points.
Figure 10: Four-Year College Attainment Rate for the Working Age Population (2020)
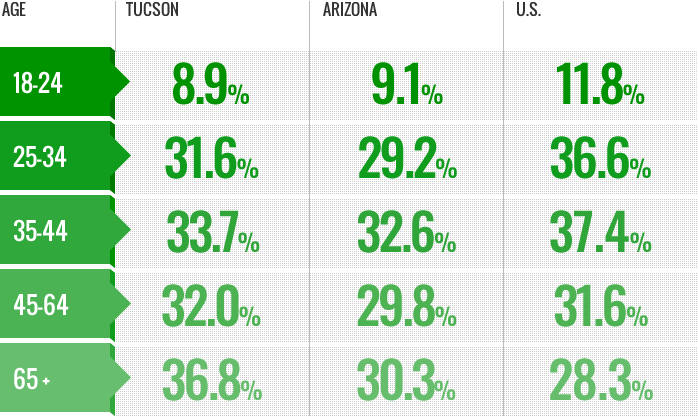
Exploring Tucson’s college attainment rate by age paints an even more dire picture. Tucson’s four-year college attainment rate significantly lags the nation for the core working-age populations. It isn’t till we reach the near retirement age group of 45-64 that Tucson’s college attainment rate equals the nation (Figure 11). However, the college attainment rate for the retirement population of 65+ in Tucson far exceeds the national rate. This indicates that Tucson is a highly desirable location for those with a college degree who are retired or near retirement age. That does not appear to be the case for the younger core working-age population.
Figure 11:Four-Year College Attainment Rate by Age (2020)
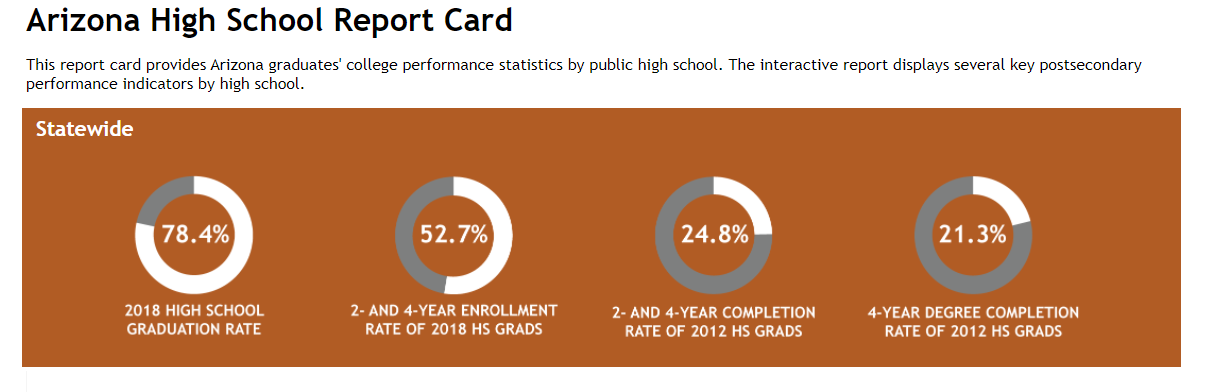
The Arizona High School Report Card provided by the Arizona Board of Regents shows an even bleaker future for our workforce with only a 78.4% high school graduation rate in 2018. Of the high school graduates in Arizona who went on to college in 2012, only 21.3% completed a four-year college degree and that rate only increased to 24.8% when including those with an associate degree. That leaves the state and Tucson region to rely on the migration of college-educated residents to the area to sustain or further increase the percentage of individuals with a four-year degree.
Figure 12: Arizona High School Report Card (created by the Arizona Board of Regents)