 Measuring Progress and Inspiring Action in Tucson's Economy
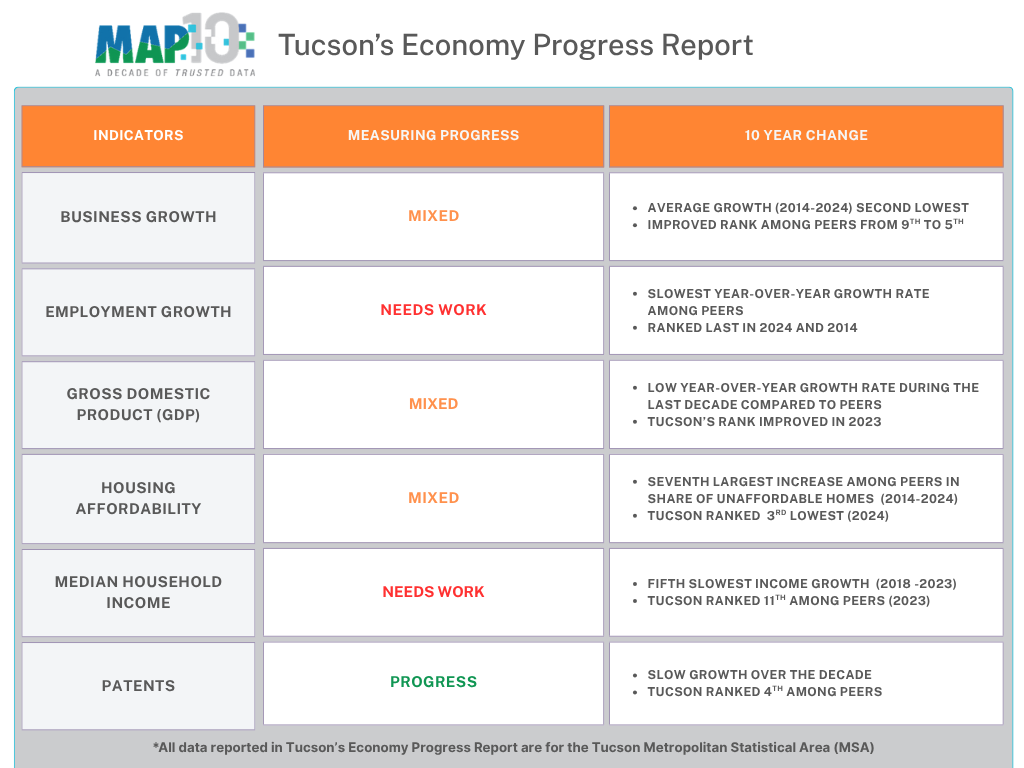
This report measures the progress of Southern Arizona's economy. It highlights the region's strengths and identifies areas that still require improvement. The MAP aims to measurably improve Southern Arizona through data-driven collective civic action and education. The data and analysis presented in the MAP Dashboard's Economy category facilitate this by identifying key trends, tracking performance, and informing future policy decisions. The MAP measures progress and inspires action by providing our leaders with facts that inform their decision-making on key issues in Southern Arizona. As the MAP Dashboard celebrates its 10th anniversary, we will examine how the economy has improved (or not) in our region over the past decade.
Key Changes Over the Past Decade in Tucson's Economy
Key changes over the past decade are highlighted below for the MAP's economy indicators, using an interactive graphic. The MAP Dashboard compares the Tucson Metropolitan Statistical Area (MSA) to other peer regions around the West. In some cases, only select regions are included in the interactive graphics to emphasize Tucson’s change. Data for all areas are available under each indicator’s core landing page. They are linked throughout the article.
Business Growth
Over the past decade, the Tucson Metropolitan Statistical Area's (MSA) growth rate in establishments improved from a ranking of 9th to 5th among peers. Changes in the total number of establishments reflect the dynamism of the local economy and shifts in the business cycle. Regions with strong business growth typically generate corresponding strong gains in jobs and income, which contribute to a higher standard of living and a larger tax base. In 2024, Tucson ranked well among peers, but its year-over-year average annual growth rate of 2.3% was among the slowest. However, Tucson has posted stronger post-pandemic growth than most comparison MSAs, signaling improved business growth in recent years.
Figure 1: Growth Rate in Establishment (2014-2024)Go to Business Growth Graph
Employment Growth by Industry
In 2024, total nonfarm employment in the Tucson Metropolitan Statistical Area (MSA) declined, making it the only peer MSA to post job losses and placing it last among peers. A decade earlier, Tucson also ranked last among peers but posted a modest 0.6% increase in employment. The year-over-year average annual employment growth in Tucson was 0.9%, again the lowest among peers. The rate of employment change is a key measure of overall economic performance. It reflects a region's ability to generate jobs, income, and economic opportunities for its residents. Persistently slow job growth can lead to higher unemployment and lower wages.
Figure 2: Growth Rate in Total NonFarm Employment (2014-2024)Go to Employment Growth Graph
Gross Domestic Product (GDP) by Industry
The Tucson Metropolitan Statistical Area (MSA) ranked third among peer MSAs in 2024 for real gross domestic product (GDP) growth, a substantial improvement from a decade earlier when it ranked 11th. However, Tucson's year-over-year average annual growth rate over the past decade remained among the lowest compared to peers. The strong performance in 2024 continued a trend of solid GDP growth since the pandemic.
Inflation-adjusted GDP measures changes in economic output over time and illustrates the composition and performance of a region's industries. In Tucson, the data show an unusually large share of GDP related to government activity, compared to Arizona and the nation. This reflects the concentration of federal civilian and military installations in the area, as well as the presence of the University of Arizona.
Figure 3: Growth Rate of Real GDP (2013-2023)Go to GDP Graph
Housing Affordability
The Tucson Metropolitan Statistical Area (MSA) has maintained relatively low housing affordability compared to peers over the past decade. In 2014, a household earning the local median family income needed to spend 27.5% of that income to afford the median-priced home that sold in Tucson. That fell below the affordability cut-off of 30% and ranked Tucson fifth among peers. Although Tucson's relative ranking improved over the past 10 years, falling to the third-lowest share of income needed, overall affordability declined substantially in Tucson and nationwide. By 2024, a household earning the local median family income needed to use 45.3% of that income to purchase the median-priced home. That was well above the 30% affordability cut-off. Households spending more than 30% of their income on housing are considered cost-burdened. Cost-burdened households often struggle to pay for basic necessities such as healthcare, education, childcare, and even food.
Figure 4: Share of Household Median Income Needed to Afford Median Priced Home (2014-2024)
Go to Housing Affordability Graph
*Values are interpolated. That means the values are filled between the actual valid data points. When paused, the visualization only displays actual values.
Median Household Income
Median household income is one of several indicators used to gauge a region's economic well-being. It reflects the financial resources available to households and is closely tied to employment levels, educational attainment, and regional economic opportunities. Over the past five years, the Tucson Metropolitan Statistical Area (MSA) maintained its ranking among peers, with the second-lowest median household income. From 2018 to 2023, Tucson's median household income increased by 33.1%, a slightly larger gain than several of its peer MSAs.
Figure 5: Median Household Income (2018-2024)
*Values are interpolated. That means the values are filled between the actual valid data points. When paused, the visualization only displays actual values.
Patents
The Tucson Metropolitan Statistical Area (MSA) has consistently ranked well among peers in patents per 10,000 workers. In 2010, Tucson ranked fourth with 15.6 patents per 10,000 workers. By 2020, the rate increased to 16.8, and Tucson's ranking remained unchanged. Utility patents provide a measure of innovation and technological change for a region, reflecting entrepreneurial activity and collaboration between a skilled workforce and local industry.
Figure 6: Patents per 10,000 Workers (2010-2020)
Why is it important?
The economic performance of a region reflects the opportunities available to residents and businesses. Regions with strong economies tend to support higher wages, a higher standard of living, and consistent job growth. A stable and resilient economy typically includes a diverse mix of industries that provide employment across a range of skill levels, which reduces vulnerability to industry-specific downturns. Improving the economic performance and opportunities within a region is often the primary goal of civic leaders and elected officials, as it contributes to the region's long-term prosperity.
Learn More
To learn more about the Economy category on the MAP Dashboard, visit the overview page. You can view more data and information about the six indicators in the Economy category by clicking on the links below.
Business Growth
Employment Growth by Industry
Gross Domestic Product (GDP) by Industry
Housing Affordability
Median Household Income
Patents
Explore the measuring progress articles already published by clicking on their link below.
- "Measuring Infrastructure Progress Over the Past Decade"
- "Measuring Education Progress Over the Past Decade"
- "Measuring Health & Social Well-Being Progress Over the Past Decade"
- "Measuring Workforce & Demographics Progress Over the Past Decade"
- "Measuring Quality of Place Progress Over the Past Decade"


