 Measuring Progress and Inspiring Action in Health & Social Well-Being
This report measures the progress of health and social well-being in the Southern Arizona region. It highlights areas where the region has excelled and identifies areas that still require improvement. The MAP aims to measurably improve Southern Arizona through data-driven collective civic action and education. The data and analysis presented in the MAP Dashboard's Health and Social Well-Being category facilitate this by identifying key trends, tracking performance, and informing future policy decisions. The MAP measures progress and inspires action by providing our leaders with facts that inform their decision-making on key issues in Southern Arizona. As the MAP Dashboard celebrates its 10th anniversary, we will look at how health and social well-being have improved (or not) in our region over the past decade.
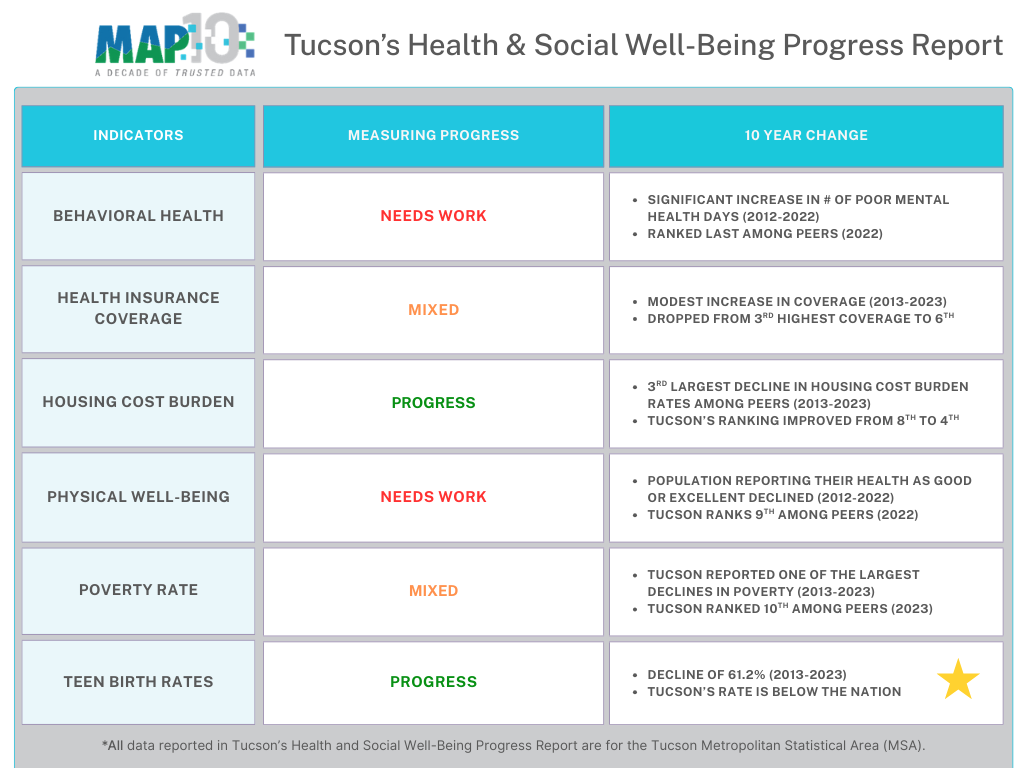
Key Changes Over the Past Decade in Health & Social Well-Being
Key changes over the past decade are highlighted below for the MAP's health and social well-being indicators using an interactive graphic. The MAP Dashboard compares the Tucson MSA to other peer regions around the West. In some cases, only select regions are included in the interactive graphics to emphasize Tucson’s change. Data for all areas are available under each indicator’s core landing page. They are linked throughout the article.
Behavioral Health
In 2012, those living in the Tucson Metropolitan Statistical Area (MSA) reported 3.5 poor mental health days each month. That ranked Tucson ninth out of 12 western MSAs. A decade later, that had increased to 5.9 poor mental health days each month, and Tucson was in last place among peers, tied with El Paso. The number of poor mental health days increased by nearly 2 1/2 days over the decade. That was one of the largest increases compared to peers, with only El Paso, San Antonio, and Portland increasing by slightly more. While all MSAs tracked on the MAP posted an increase in the number of poor mental health days between 2012 and 2022, Las Vegas had the smallest increase and moved from a last-place ranking in 2012 to fifth in 2022.
Additional information on the MAP's behavioral health indicator shows significant improvements in the percentage of the population who smoke over the past decade for the Tucson MSA. In 2012, 17.2% of the population in the Tucson MSA reported smoking, a rate that decreased to 14.0% by 2022; however, this remained higher than the state and national rates. Further, Arizona reported the third lowest rate of depression among the western states.
Figure 1: Number of Poor Mental Health Days per Month (2012-2022)Go to Mental Health Days Graph
*Values are interpolated. That means the values are filled between the actual valid data points. When paused, the visualization only displays actual values.
Health Insurance Coverage
The Tucson Metropolitan Statistical Area (MSA) experienced only a modest increase in the percentage of the population with health insurance coverage over the last decade. Tucson's rate of 85.2% in 2013 increased by 5.9 percentage points to 91.1% in 2023. While Tucson's health insurance rate increased over the past decade, the nation and many comparable peer MSAs posted significantly faster growth. In 2013, Tucson, tied with Denver, had the third-highest rate of coverage among peers. In 2023, that ranking had fallen to sixth. It is important to note that the major provisions of the Affordable Care Act (ACA) took effect in 2014, leading to increased health insurance coverage rates nationwide. The Tucson MSA had a lower rate of children (those 18 years and under) with health insurance coverage than the nation in 2023.
Figure 2: Percent of Residents with Health Insurance Coverage Over the Past Decade (2013-2023)Go to Health Insurance Graph
*Values are interpolated. That means the values are filled between the actual valid data points. When paused, the visualization only displays actual values.
Housing Cost Burden
The Tucson MSA experienced the third-largest decline among peer MSAs in the percentage of households paying more than 30% of their income in housing-related costs over the past decade. Only the Salt Lake City and Phoenix MSAs posted a larger decline. In 2013, 37.8% of households in Tucson were considered to be housing cost-burdened, which ranked Tucson eighth among peer MSAs. By 2023, the percentage of housing cost-burdened households had fallen to 31.8%, improving Tucson's ranking to fourth. While Tucson fares well among peer communities in the overall rate of households that are cost-burdened, when the data is explored by income, Tucson struggles to provide affordable options for those in its lower income brackets when compared to its national peers.
Figure 3: Percent of Housing Cost Burden Households Over the Past Decade (2013-2023)Go to Housing Cost Burden Graph
*Values are interpolated. That means the values are filled between the actual valid data points. When paused, the visualization only displays actual values.
Physical Well-Being
In 2022, 80.8% of the population in the Tucson Metropolitan Statistical Area (MSA) reported having good or excellent health. That ranked Tucson ninth out of peer MSAs. That was a decline from a decade earlier, when 81.8% of the population reported good or excellent health. Tucson's ranking remained unchanged among peers over the last decade. Nearly all of the MSAs explored on the MAP reported a decline in the percentage of the population reporting good or excellent health between 2012 and 2022, except for Denver, which saw a slight increase.
Figure 4: Percent of the Population Who Reported Good or Excellent Health Over the Past Decade (2012-2022)Go to Good Health Graph
*Values are interpolated. That means the values are filled between the actual valid data points. When paused, the visualization only displays actual values.
Poverty Rate
The Tucson MSA had the 10th-highest poverty rate among its peers in 2023, an improvement from a decade earlier, when Tucson ranked 11th. Tucson's poverty rate of 19.2% in 2013 declined by 4.8 percentage points over the decade to 14.4% in 2023. That was one of the largest percentage point drops compared to its peers, with only Phoenix and Austin performing better. Despite the decline, Tucson's poverty rate remains significantly higher than the national rate.
Figure 5: Percent of the Population in Poverty Over the Past Decade (2013-2023)Go to Poverty Graph
*Values are interpolated. That means the values are filled between the actual valid data points. When paused, the visualization only displays actual values.
Teen Birth Rate
Teen birth rates have dropped significantly in the Tucson MSA and nationally over the past decade. In 2023, Tucson had a rate of 15.3 births per 1,000 females aged 15-19. That ranked Tucson sixth among its peers in 2023, an improvement from 2013, when Tucson had the seventh-highest teen birth rate. Tucson's teen birth rate declined by 61.2% between 2013 and 2023, declining from 39.5 births per 1,000 females aged 15-19 in 2013 to 15.3 in 2023. Tucson's teen birth rate declined at a faster pace than the nation, and it dropped below the national rate in 2022.
Figure 6: Teen Birth Rate Over the Past Decade (2013-2023)Go to Teen Birth Graph
*Values are interpolated. That means the values are filled between the actual valid data points. When paused, the visualization only displays actual values.
Why is it important?
Indicators in this Health and Social Well-being category identify critical trends for Southern Arizona residents. Measures of physical and behavioral well-being provide essential information about the health of residents, which plays a vital role in determining the overall quality of life. Households that are housing cost-burdened or whose income is at or near the poverty level are more likely to endure adverse social, economic, and health conditions. Likewise, those who lack health insurance coverage are at greater risk for bankruptcy and preventable illness. The data provide residents and policymakers with performance measures crucial to gauging the overall well-being of a region.
Learn More
To learn more about the education category on the MAP Dashboard, visit the overview page. You can view more data and information about the six indicators in the Health and Social Well-being category by clicking on the links below.
Behavioral Health
Health Insurance Coverage
Housing Cost Burden
Physical Well-Being
Poverty Rate
Teen Birth Rate
Explore the articles already published by clicking on their link below. Stay tuned for the remaining articles, which will measure the progress of each of the MAP’s six categories.
- "Measuring Infrastructure Progress Over the Past Decade"
- "Measuring Education Progress Over the Past Decade"


