Have you ever wondered how affordable housing is in Tucson? Now you can find out on the MAP Dashboard. The MAP recently released the Housing Affordability indicator that calculates the share of homes sold that are affordable to those earning the median family income for the area. Likewise, the NYU Furman Center recently released the 2017 National Rental Housing Landscape report that explores median rental prices and affordability based on household income levels. In this article, we focus on the concept of housing affordability from the renter’s perspective concluding with key differences between the affordability of rentals versus purchases.
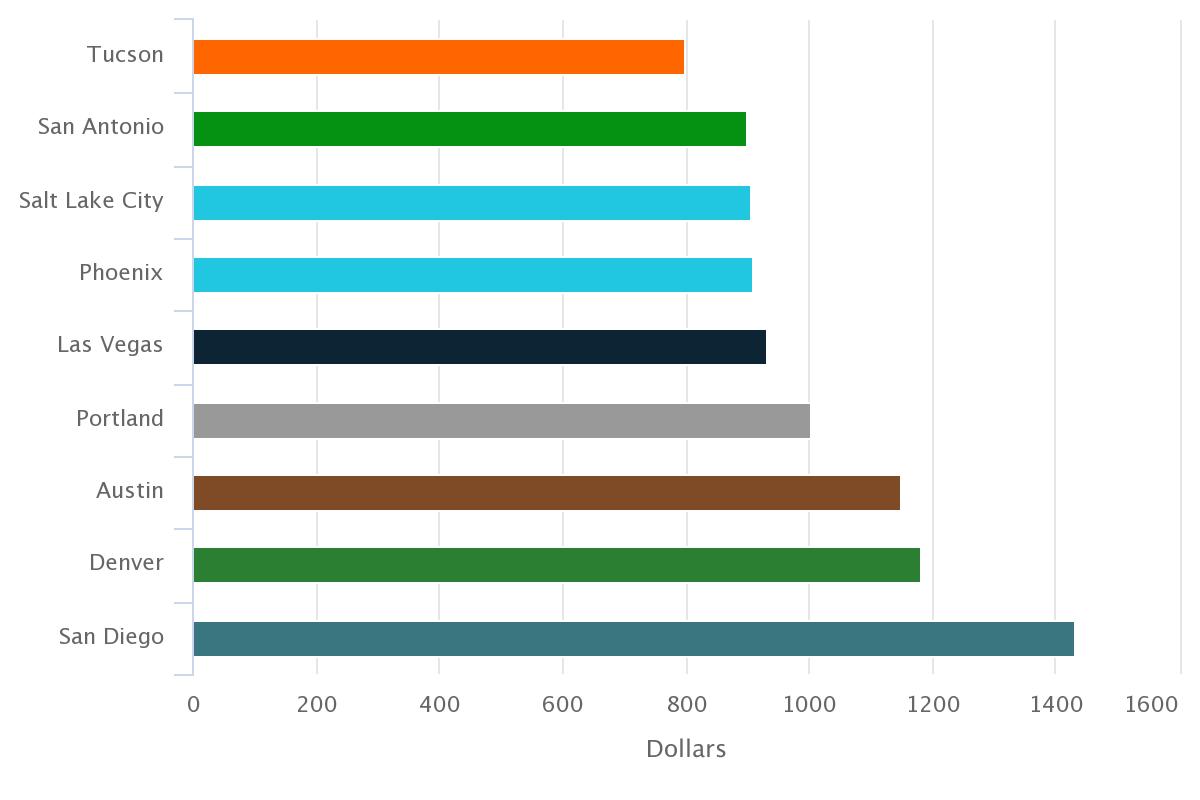
According to the Census Bureau, renters occupied nearly 40.0% of the housing units in Tucson during 2015. The National Rental Housing Landscape study examined how affordable rental units are to those earning the median household income for select metropolitan areas. According to the study, the median rent in Tucson for a two-bedroom unit was $800 in 2015. When compared to peer metropolitan areas Tucson’s rental price was the lowest (Figure 1).
Figure 1: Median Rent for Two-Bedroom Unit for Select Western Metropolitan Areas (2015)
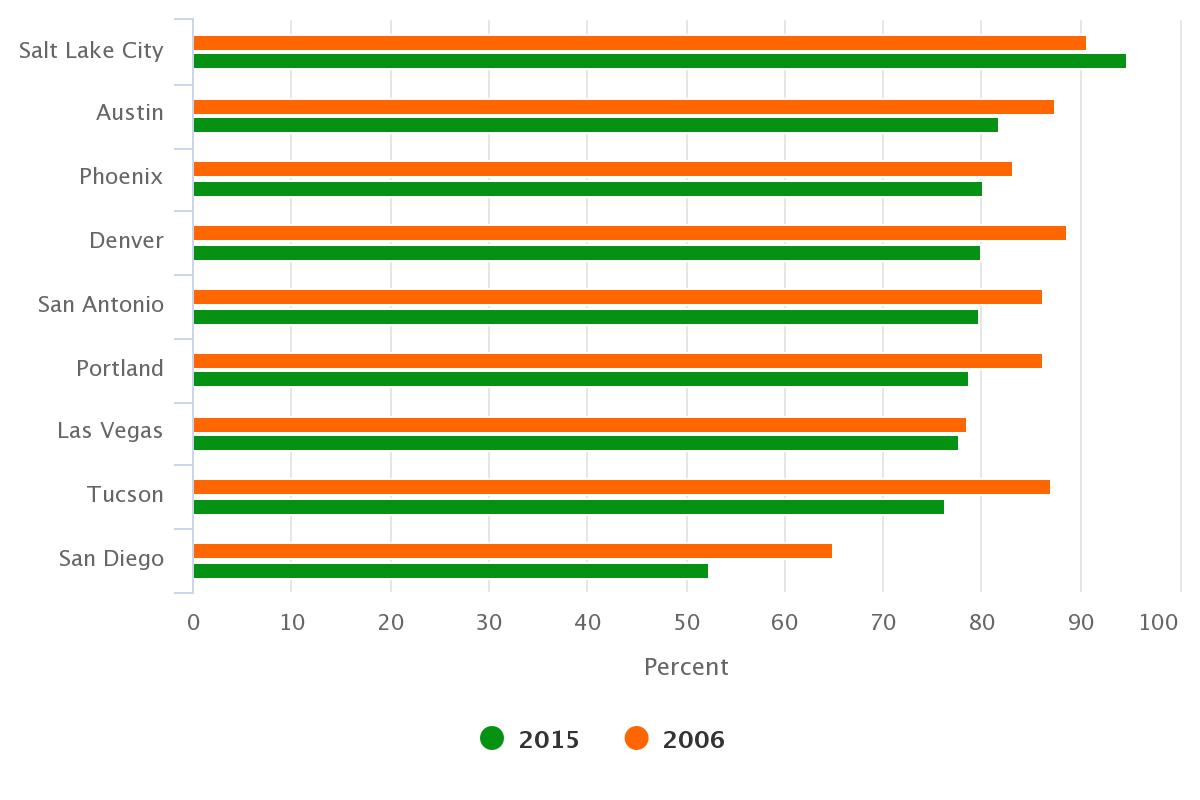
Despite Tucson’s low rent, the share of rentals that are affordable to those earning the median household income was quite low relative to peer metropolitan areas. The National Rental Housing Landscape study defines affordability based on the local median household income and the assumption that the renter does not spend more than 30% of their income on rent. In 2015, 76.2% of recently available rentals were affordable in Tucson based on the above criteria. That ranked Tucson eighth out of the nine western metropolitan areas tracked, as Figure 2 shows.
In addition, Tucson’s share of affordable rentals decreased by nearly 11 percentage points since 2006. The reduction in affordable rentals was felt in almost every metropolitan area examined, with the exception of Salt Lake City. Since affordability is based on both rents and income, this decrease could be caused by an increase in rental prices, a reduction in income, or a combination of both.
Figure 2: Share of Affordable Rentals for Those Earning the Local Median Household Income for Select Western Metropolitan Areas
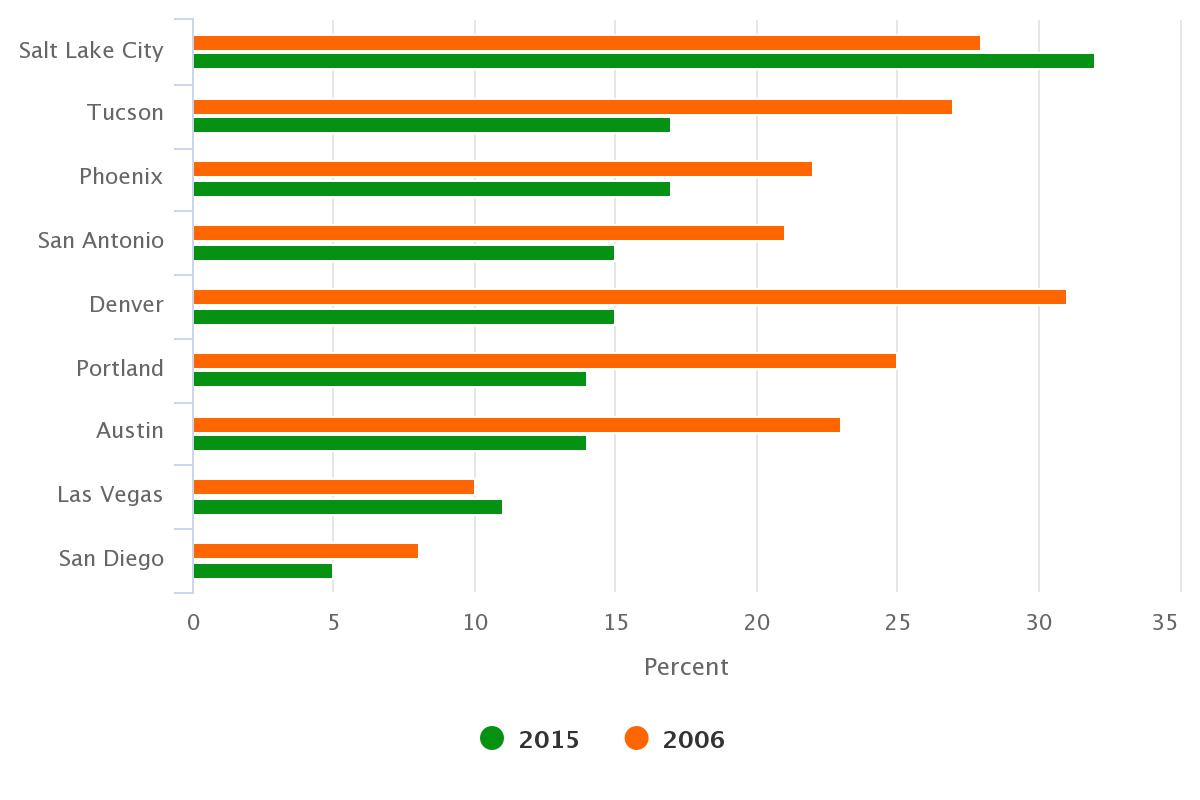
Tucson fared substantially better when compared to peer western metropolitan areas for renters that spend less than 30% of their income on rent but earn only 50% of the local median household income. Only Salt Lake City had a higher share of recently available rentals that were affordable to households earning half of the local median income. Tucson and Phoenix tied for second with 17% of rentals affordable. San Diego came in last with only 5% of rentals affordable to those households. Figure 3 highlights the share of affordable rentals for those earning 50% of the local median household income and spending less than 30% of their income on rent.
Figure 3: Share of Affordable Rentals for Those Earning 50% of the Local Median Household Income for Select Western Metropolitan Areas
The affordability of rentals only tells part of the story. The recently released Housing Affordability indicator explores the share of homes purchased that were available to those earning the median family income for the area. In 2016, Tucson ranked first among peer western metropolitan areas with 76.3% of homes sold affordable. It is important to note that rental affordability and housing affordability use different income measures to calculate the share of affordable units. Therefore, they are not directly comparable.
Rental affordability calculations utilize median household income, which covers all households, including those with persons living alone or multiple unrelated individuals. These households tend to have a large percentage of young or old individuals. Housing affordability is calculated using median family income, which consist of more than one person in the household related by birth, marriage, or adoption. Median family income is typically higher than median household income. In Tucson, median family income was more than $11,000 higher than median household income in 2015.
Housing affordability is an important issue for both owners and renters. When households pay more than 30% of their income in rent or mortgages they are more likely to struggle to pay for other basic needs such as health care, childcare, transportation, and even food. These households are considered cost burdened. To learn more about cost burdened households in Tucson visit the Housing Cost Burden indicator.
To learn more about the affordability of recently purchased homes visit the Housing Affordability indicator.


