 People with Disabilities: Economy Security and Health in Tucson, Arizona MSA
Poverty
Disability can be both a cause and a consequence of socio-economic instability. Often, it leads to job loss, reduced earnings, substantial disability-related costs, and barriers to education and training. As highlighted in the Economic Justice is Disability Justice report by the Century Foundation, disability can also be a consequence of economic insecurity because poverty and economic instability impede access to health care and increase the likelihood of living and/or working under unhealthy conditions. In this way, disability and poverty are profoundly interconnected.
This second article of the disability series sets the stage for a closer examination of the multifaceted nature of poverty, employment, and healthcare within the disabled community and the imperative need for comprehensive policies and societal changes to address this issue. Please click here to explore our first article of this set about the population, prevalence, and education of individuals with disabilities.
According to a report by the National Disability Institute, disability and poverty reinforce each other, contributing to increased vulnerability and exclusion. One purpose of tracking these data is to provide visibility to people with disabilities who are living in poverty and enable making the decisions that will mitigate and ultimately eradicate this situation. As the United Nations in the 2030 Agenda for Sustainable Development states, disability cannot be a reason or criteria for lack of access to development programming and the realization of human rights.
In 2021, the poverty rate of individuals with disabilities aged 18-64 years in the U.S. was 25.0%, while the poverty rate of individuals without disabilities was 10.3%- a difference of 14.7 percentage points (Figure 1). The poverty gap was smaller in Arizona and Tucson compared to the Nation, where the differences were 11.7 and 11.0 percentage points, respectively.
Figure 1: Poverty Rate by Disability Status: U.S, Arizona, and Tucson MSA (18-64 Years Old) 2021
Individuals with disabilities 65 years and over experienced higher poverty rates in Arizona (49.7%) and Tucson (51.9%), compared to the U.S. (13.2%). The working-age population (18-64 years) had similar poverty rates in Tucson at 25.4% compared to the nation at 25.0%. In comparison, only people with disabilities in Arizona under the age of 18 (25.2%) and those between the ages of 18 and 64 (23.3%) had poverty rates that were lower than those in the United States, at 26.1% and 25.0%, respectively (Figure 2).
Figure 2: Poverty Rate Among People With Disabilities by Age Group in the U.S., Arizona, and Tucson (2021)
Employment
The statistics of disability and employment are critical tools to understand the relationships between these factors and to track improvements of employment opportunities and outcomes for people with disabilities. Before 2008, there was no mechanism to measure the labor force participation rate for people with disabilities on a regular basis. Nowadays, we count with up-to-date monthly data that provide citizens and policymakers with reliable and accurate information, which can be used to reduce the employment gap between people with and without disabilities.
The population of 18- to 64-year-olds in Arizona was 4.1 million in 2021, which encompasses the principal working ages for most individuals. Employment rates were substantially lower for individuals that had a disability compared to those without, 40.8% and 76.0%, respectively. The same held true for the percent working full-time, which was 31.3% for people with a disability compared to 57.4% for those without. A larger portion of people with disabilities were not in the labor force compared to those in the labor force - in other words, not looking for work. Median earnings for those aged 16 years and older reflect less pay for individuals that have a disability. Table 1 highlights select employment characteristics in Arizona for those with and without a disability.
Table 1: Employment Characteristics With and Without a Disability in Arizona (2021)
Arizona's employment rate of 40.8% for individuals with a disability in 2021 was two percentage points higher than the U.S. at 38.9%. Nevertheless, Arizona's rate fell far behind the rate of other states. In fact, Arizona ranked 23rd out of all states and eighth out of the 10 MAP Dashboard states. North Dakota ranked the highest with 54.8% and West Virginia was last with only 29.2% employed. Figure 3 highlights the percent of the population with a disability that were employed for the MAP Dashboard states.
Figure 3: Percentage of the Employed Population With a Disability by State (2021)
In 2021, the education and health services industry employed 22.5% of all employed persons with a disability in the United States, 20.9 % in Arizona, and 22.6 % in Tucson. The retail trade industry ranked second in the United States (13.1%), Arizona (14.2%), and Tucson (14.0%) in terms of employment opportunities for people with disabilities. The percentage of employed Individuals with disabilities in the professional, scientific, and management sectors was higher in Tucson (14.0%), compared to the U.S. (10.9%). The same held true for the percent of workers in the finance and real estate sector where Arizona posted 2.7 percentage points higher than in the U.S. Only 1.1% of disabled workers in Arizona and 0.8 % in Tucson were employed in the mining, forestry, fishing, and hunting industries. Figure 4 shows the employment rates for the disabled population by industry. Click on the drop-down menu to view Arizona or the U.S.
Figure 4: Employment Rates for the Disabled Population by Industry (2021)
As illustrated in Figure 5, the employment rate for the disabled population in Tucson decreased by 4.0% between 2015 and 2021, while it increased by 7.3% in Arizona and 4.9% nationally.
Figure 5: Percentage of Employed With Disability in the U.S., Arizona, and Tucson MSA (2015-2021)
Healthcare
As maintained by the Centers for Disease Control and Prevention (CDC), people with disabilities face many barriers to good health. They are more likely than people without disabilities to report having poorer overall health, have less access to adequate health care, and more frequently engage in risky health behaviors such as smoking and physical inactivity. In this sense, it is essential to track healthcare data for people with disabilities to assure progress is made towards disability inclusion.
In 2021, 94.1% of individuals with disabilities in Arizona (ages 18-64 years) had health insurance coverage. That was a difference of 0.3 percentage points less than the nation and the Tucson MSA. In contrast, 88.6% of individuals without disabilities had health insurance coverage -a gap health insurance coverage between those with and without disabilities of 5.5 percentage points. That gap was less in Tucson MSA (3.9 percentage points).
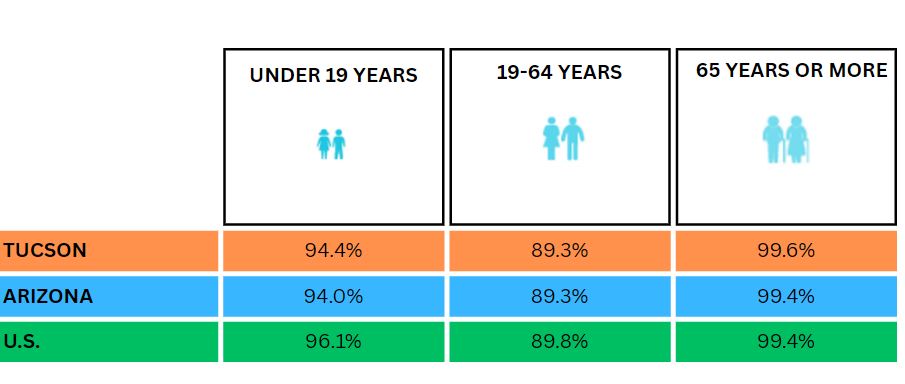
In 2021, the Tucson MSA (at 94.4%) and the state of Arizona (at 94.0%) had health insurance rates for children with disabilities that were lower than the nation (96.1%). Arizona and Tucson had health insurance rates similar to the U.S. (89.8%) for the working-age population (ages 18-64 years), at 89.3%. (See Figure 6).
Medicare provides medical health insurance to people under 65 with certain disabilities and any age with end-stage renal disease (permanent kidney failure requiring dialysis or a kidney transplant), resulting in a high rate of coverage.
Figure 6: Percentage of Disabled Population With Health Insurance by Age in the U.S, Arizona, and Tucson (2021)
Disability Healthcare Costs
According to the National Disability Institute, adults with disabilities are less likely to lack health insurance than those without disabilities because they are much more likely to be covered by Medicare or Medicaid. Nevertheless, they are more than twice as likely to have difficulty paying their medical bills. These bills may be the result of out-of-pocket expenses for co-payments and deductibles or uncovered services.
As reported by the National Council on Disability (NCD) in the Impact of COVID-19 on People with Disabilities, many people with disabilities excluded from the labor market are in a “poverty trap”; they rely on federal public assistance programs, and cannot work without losing essential healthcare.
Disabled people have a wide range of health and support requirements. In comparison to people who are not disabled, they frequently require long-term services and support to address functional limitations and fully participate in society
In 2015, disability-associated healthcare expenditures (DAHE) for all US totaled $868 billion. That was 340 billion more than in 2003. Of the national total, the DAHE was $324.7 billion for Medicare expenditures, $277.1 billion for Medicaid expenditures, and $ 266.1 billion for nonpublic sources.
The state-level DAHE varied by the state due to differences in demographic characteristics, access to and quality of care, the severity of the disability, the prevalence of chronic conditions, and coverage and payment policies. For instance, in Arizona, the DAHE percentage was 37% of total expenditures (14.8 billion), and in Utah was 29% of total expenditures (4.8 billion).
The mean state-level DAHE per person with disabilities (PWD) in 2015 was $17,431. Among ten western states, Arizona ranked seventh ($14,326). The highest mean DAHE per PWD was California ($19,949), followed by Texas ($17,189). Idaho posted the lowest mean DAHE per PWD ($14,059). Figure 7 shows the estimated mean DAHE per PWD by western states.
Figure 7: Mean Disability-Associated Health Care Expenditures (DAHE) Per Person With a Disability (PWD) (2017 Prices) by States
Source
Disability status data come from the 2021 American Community Survey (ACS) 5-year estimates published by the U.S. Census Bureau. The Census Bureau changed the way they handled questions on disability in the 2008 ACS, so current data are not comparable to previous ACS releases or the Census 2000. This article utilizes data from the Centers of Disease Control and Prevention (CDC) and Public Health Report SAGE Journals to estimate healthcare costs.