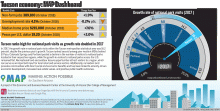
In 2017, the Tucson Metropolitan Statistical Area (MSA) posted a four-year educational attainment rate of 31.6%. Tucson ranked seventh when compared to the 12 MSAs explored on the MAP Dashboard. Tucson’s educational attainment rate increased by 4.9 percentage points since...
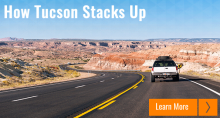
Putting Miles on Our Cars: How Far Do People in Tucson, Arizona Drive Per Day Have you ever wondered how far your fellow Tucsonan drives in a typical day? Or which roads they are more likely to use? Data reported...
As poverty numbers swell year-to-year -- a 2016 United States Census Bureau report suggested nearly 18 percent of Arizonans live in poverty, which is the fifth highest rate of poverty in the nation - is the good done by local...
Have you ever wondered how your fellow business leaders, non-profits, elected officials, or engaged community members use the MAP Dashboard to make informed decisions? Throughout the year the Community Spotlight will highlight how members of the Southern Arizona community utilize...
In 2017, the growth rate in national park visits within the Tucson MSA was 16.2 percent, double the previous year’s growth. Tucson ranked second among peer western MSAs behind El Paso. Colorado Springs and Portland posted a decline in the...
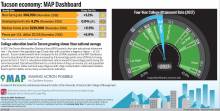
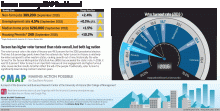
The Tucson Metropolitan Statistical Area economy is back on track and growing at a solid rate. Click the link below to read the full article. View Article
The United States Southwest is experiencing what some believe to be the worst drought in 500 years (Kuhn, 2016). Studies have projected that the region will experience a more arid climate and higher risk of water shortages over the coming...
The voter turnout rate in the state of Arizona was 49.9 percent for the 2016 presidential election. That was 5.6 percentage points lower than the national rate. Voter turnout in Arizona is relatively low when compared to other western states...