 People with Disabilities: Earnings, Home Environment, and Infrastructure in Tucson, Arizona MSA
Earnings
This third and last article of the disability series provides a closer examination of how the multifaceted nature of earnings, home environment characteristics, and infrastructure, affect and are interrelated with the disabled community. In the first and second articles, you can explore how data related to population, education, employment status, poverty, and access to the healthcare system, compare people with and without disabilities in the state of Arizona and the Tucson MSA.
Based on the most recent Census data, people with disabilities still lag behind their peers without disabilities in terms of gaining earnings. According to the report ‘Disabilities’ by the American Institutes for Research, earnings inequalities certainly exist between people with and without disabilities despite of educational attainment. Surprisingly, the gap widens as educational attainment increases. Workers with disabilities earn less than their non-disabled counterparts in terms of hourly, weekly, and monthly earnings.
The median annual wage for workers with disabilities (population 16 years and over) in the U.S. was $26,733 in 2021. Workers without disabilities earned $13,007 more per year on average. In 2021, workers with disabilities in the Tucson MSA reported annual median wages of $23,307. These median wages were $10,144 lower than those of non-disabled workers and $3,426 lower than the national average (Figure 1).
Figure 1: Median Annual Earnings by Disability Status in the U.S, Arizona, and Tucson MSA (2021)
In 2021, among 10 western states tracked by the MAP dashboard, six surpassed the national annual median wages for workers with disabilities. Washington reported the highest annual median wages ($31,8650) and Idaho the lowest ($21,851). Employees with disabilities in Arizona earned 1.3 percent more (i.e., $352) than the national median salary.
The annual median wages for workers with disabilities vary significantly by gender. Among 10 western states, women with disabilities have lower median wages than men with disabilities. In Arizona, disabled women earned 79.3% of what disabled men did. In Utah, disabled women made 60.1.% of what disabled men did (the largest disability gender wage gap). In Nevada, disabled women made 82.8% of what disabled men made, the smallest disability gender wage gap amongst tracked states. The ratio of male-to-female earnings indicates what a disabled female worker earns compared to the amount a male employee with a disability in the same position would receive. The interactive map in Figure 2 visualizes this difference (earnings gap) between male and female workers with disabilities among 10 western states in 2021.
Figure 2: Median Annual Earnings Gap by Gender Among 10 Western States (2021)
Home Environment
Living independently and being part of the community are among the most important values and goals for people with disabilities. For these individuals, living in their own homes, whether rented or owned, is an essential element of independence.
Federal nondiscrimination laws provide housing protections for individuals with disabilities. The Fair Housing Act prohibits discrimination in housing and housing-related transactions because of disability status. In the same vein, the Americans with Disabilities Act (ADA) is a comprehensive civil rights law for persons with disabilities. This includes housing protection in cases where the housing is provided or made available by a public entity, regardless of whether the entity receives federal financial assistance.
Despite these laws, disabled people are currently facing a severe housing crisis and the federal programs are not meeting their needs. As reported by the Urban Institute in the “People with disabilities living in the U.S. face urgent barriers to housing”, 18 million disabled people are eligible for federal housing assistance but are not receiving it. In the same way, 7 million disabled individuals live with an adult head of household who is a relative, and 52% of those heads of household are 55 or older. Tracking housing affordability data for those individuals remains crucial, to ensure appropriate socioeconomic improvements can be implemented to meet their needs.
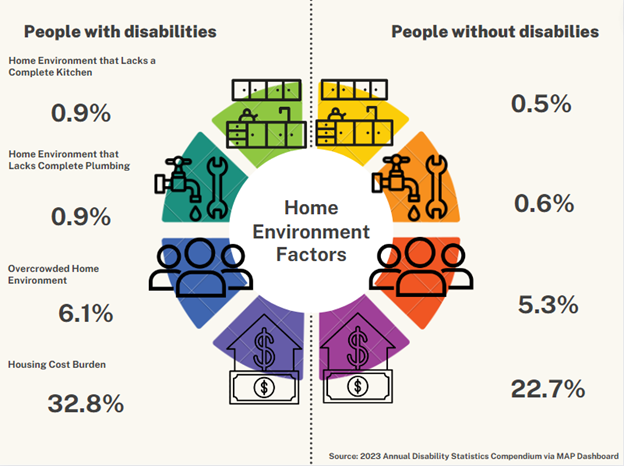
Important home environment factors that are tracked include housing quality, age of home, and housing type for people with and without disabilities. These housing quality features are displayed in the graph below, which include: the absence of a complete kitchen, the absence of complete plumbing, overcrowding (two or more people per bedroom), and cost burden (thirty percent or more of household income spent on housing costs).
In 2021, individuals with disabilities in Arizona experienced more difficulties in all four quality features listed above compared to those without disabilities. For instance, 6.1% of people with disabilities live in an overcrowded environment, compared to 5.3% of people without disabilities. Concerning the housing cost burden, the percentage of people with disabilities experiencing housing cost burden was 32.8% compared to 22.7% for individuals without disabilities. Overall, 13.8% of the population with disabilities lived in poor-quality housing (i.e., experienced two or four possible difficulties related to housing quality) in 2021 versus 8.8% of those without disabilities. The infographic below displays the home environment characteristics for people with and without disabilities (18-64 years) in Arizona in 2021.
In 2021, among ten western states, Arizona ranked second –at 47.9%– in terms of the percentage of the population with disabilities living in housing built in 1990 or later, the year the Americans with Disabilities Act (ADA) was enacted. Nevada ranked first at 55.1%, and California ranked last at 25.8%.
For housing type, 66.9% of people with disabilities in Arizona lived in a house and 22.5% in apartments in 2021. In addition, Arizona placed third among ten western states for the percentage of individuals with disabilities living in mobile homes or other building types, with 10.6%, followed by Oregon (11.8%) and New Mexico (21.0%).
Infrastructure
The term infrastructure encompasses all the facilities, resources, and tools that people use on a daily basis to live a safe, equitable, and healthy life. Americans with disabilities depend on the disability workforce infrastructure, which consists of health, education, and social services programs. The need for these services is expected to increase significantly in the coming decades, and according to the BLS projects workers in health and medical services will be in high demand over the next ten years. The single highest increase in demand expected is for home health aides, which directly affects the quality of life of people with disabilities.
The American Association of People with Disabilities (AAPD) maintains that the current infrastructure of the nation is still inaccessible for people with disabilities and leaves these individuals behind, although they see the Infrastructure Investment Jobs Act as an encouraging shift of policy. The Act includes $550 billion in new spending and reauthorizes surface transportation funds until 2026, representing a roughly $1.2 trillion overall commitment. This bill will create historic levels of investments in our national infrastructure and promote an equitable economic recovery that will improve the quality of life for people with disabilities. For instance, this bill will increase investment in public transit programs, such as the Enhanced mobility of seniors and individuals with disabilities with a budget of $2.1 billion.
Among modes of transportation to work in 2021, commuters with disabilities driving alone in the U.S., Arizona, and Tucson posted rates lower than those without disabilities driving alone. The Tucson MSA posted a rate of 66.9% of commuters with disabilities driving alone to work, which was nearly seven percentage points less than for commuters without disabilities.
In contrast, people with disabilities carpooled more and were more likely to use public transportation than those without disabilities. However, Tucson and Arizona lagged behind the U.S. in the percentage of commuters using public transportation to work, at 3.6% and 2.4%, respectively, in comparison to 4.5% for the nation. The state of Arizona posted a higher rate of commuters with disabilities working from home than Tucson or the U.S., at 12.6% - three percentage points ahead of the U.S. and two percentage points ahead of Tucson. Figure 4 highlights the percentage of commuters with and without disabilities in the U.S., Arizona, and Tucson by modes of transportation. Click on the drop-down menu to view the mode of transportation.
Figure 3: Percentage of Commuters With and Without Disabilities in the U.S., Arizona, and Tucson by Modes of Transportation (2021)
In March 2022, the National Highway Traffic Safety Administration (NHTSA) finalized a new rule that improved equity and mobility for drivers and passengers with disabilities. This final rulemaking allows specific modifications to vehicles to allow for adaptive equipment.
Moreover, the Infrastructure Investment Jobs Act also includes investments in broadband and digital equity to make sure that everyone in the United States has access to high-speed internet and works to close the digital divide that disabled people and other historically underrepresented groups often face. In that sense, the National Telecommunications and Information Administration (NTIA) Internet Use Survey found that in 2021, 66.5% of the U.S. population with disabilities were living in a household with internet use compared to 79.5% for those without disabilities.
According to the National Council on Independent Living, disabled people are two to four times more likely to be injured or killed during disasters. For example, out of the total population 18-years-and-older that were displaced in 2022 due to natural disasters, 69.7 % of deaf people who were evacuated reported living in unsanitary conditions a month after the disaster. That is more than double the displacement rate for people without hearing problems. More than 74 % of evacuees unable to walk reported experiencing a lack of food one month after a disaster. That is 65 percentage points higher than individuals without walking difficulties. Therefore, as disasters become more common due to climate change, attempts to solve the climate problem and mitigate its impacts on the U.S. population must consider the realities of disabled people. With regards to the COVID-19 pandemic, the U.S. Census Bureau Household Pulse Survey provides real-time data on how this has affected people’s lives, including those of people with disabilities.
While social and political changes have been made to improve living conditions and employment opportunities for people with disabilities, the data indicate a need for continuity in good policy practices and research to continue closing the gaps that still exist relative to those without disabilities. As individuals living in a community, all of us can participate in improving disabled people's lives in different ways, such as increasing equitable access to education, work, community living, healthcare, and more.


