Infrastructure is the foundation of economic activity. It takes many forms, including highways and roads, water and sewer, telecommunications, airports, and border facilities.
Many forms of infrastructure are meant to be widely and easily available to users. Funding for this infrastructure through user fees, fee-for-service mechanisms, gas, and other related-input taxes, however, is insufficient to maintain it or expand it due to the level of use vs. associated infrastructure costs. In response, most jurisdictions rely on a variety of federal, state, and local funding sources. Sometimes local revenues are raised through a broad-based tax, such as a sales tax levied on a wide range of purchases. This tax revenue, therefore, is a tool to fund infrastructure and/or transit which translates to regional investments.
The Tucson metropolitan statistical area (MSA) and many of the comparable MSAs listed on the MAP Dashboard partially fund transportation infrastructure with a sales tax. These MSAs are listed in Figure 1, along with metropolitan (or county) population and per capita personal income for calendar year 2022 (data for Pinal County is for 2019). The Tucson MSA is composed of Pima County.
Figure 1: MAP Regions with Sales Tax Revenues to Support Transportation
| Metro Area | Jurisdiction | Revenue Source | Population 2022 | Per Capita Personal Income 2019 |
|---|---|---|---|---|
| Austin* | Hay, Travis, Williamson, TX | Capital Metro | 2,268,926 | $77,218 |
| Colorado Springs* | El Paso County, CO | Pikes Peak Rural Transit Authority | 740,596 | $61,074 |
| Denver* | Denver RTD metro, CO | Regional Transportation District | 3,602,779 | $83,746 |
| Las Vegas | Clark County, NV | Regional Transportation Commission of So. Nevada | 2,322,535 | $59,161 |
| Phoenix | Maricopa County, AZ | Prop 400. Maricopa County Transportation Excise Tax | 4,555,833 | $63,401 |
| Phoenix | Pinal County, AZ** | Pinal Regional Transportation Authority | 416,657 | $37,139 |
| Salt Lake City | Salt Lake County, UT | Local Option Sales Taxes | 1,186,569 | $66,309 |
| San Diego | San Diego County, CA | TransNet | 3,277,176 | $74,304 |
| Tucson | Pima County, AZ | Pima County Regional Transportation Authority | 1,057,476 | $54,470 |
| Source: Population and income data from bea.gov | ||||
| *Not all governments in these regions collect the tax. | ||||
| **Pinal County data for 2019 | ||||
Figure 2 shows the relevant transportation sales tax rate and revenues for the fiscal (or calendar) year 2022. Pinal County data is for 2019 because their sales tax is not currently being implemented. We show total revenues, as well as revenues on a per capita and on a per dollar of personal income basis. Note that the sales tax jurisdiction sometimes differs from the metropolitan area boundaries. See the detailed descriptions below for more.
Revenues for most regions are reported for fiscal years, with the exception of Denver which is on a calendar year basis. Most fiscal years end on June 30 of the year and begin on July 1 of the prior year. For example, for the Regional Transportation Authority (RTA) of Pima County, fiscal year 2022 began on July 1, 2021, and ended on June 30, 2022. The exception here is Austin, where the fiscal year ends on September 30.
As the figure shows, sales tax rates varied from a maximum of 1.05% (Salt Lake County, Utah) to a minimum of 0.375% (Clark County, Nevada).
Revenues generated directly from the sales tax in 2022 ranged from $855.1 million in Denver’s Regional Transportation District (RTD) to $110.7 million in Pima County. On a per capita basis, Salt Lake County raised the most revenue while Pima County raised the least. Per $1,000 of personal income, Salt Lake County raised the most revenue while San Diego raised the least.
Figure 2: Transportation sales tax revenues in 2022 for MAP Regions
| Jurisdiction | Tax Rate | Revenue | Per Capita Revenues | Revenues per $1,000 Personal Income |
|---|---|---|---|---|
| Hays, Travis, Williamson, TX | 1.000% | $366,924,492 | $161.70 | $2.09 |
| El Paso County, CO | 1.000% | $152,521,959 | $205.90 | $3.37 |
| Denver RTD metro, CO | 1.000% | $855,146,000 | $237.40 | $2.83 |
| Clark County, NV | 0.375% | $482,796,883 | $207.90 | $3.51 |
| Maricopa County, AZ | 0.500% | $664,849,703 | $145.90 | $2.30 |
| Pinal County, AZ* | 0.500% | $17,100,000 | $41.00 | $1.11 |
| Salt Lake County, UT | 1.050% | $417,099,747 | $351.50 | $5.30 |
| San Diego County, CA | 0.500% | $409,028,958 | $124.80 | $1.68 |
| Pima County, AZ | 0.500% | $110,676,000 | $104.70 | $1.92 |
| Source: Jurisdiction budget and other public documents, author's calculations | ||||
| *Pinal County data for 2019 | ||||
Figure 3 shows the distribution of total revenues by jurisdiction and the applicable sales tax rate, ranked revenues. Note that for total revenues, little association occurs between the tax rate and total revenues.
Figure 3: Transportation sales tax revenues in 2022 by metropolitan area and applicable tax rate (ranked by revenues in millions)
The big differences in revenues across regions reflect different sales tax rates, economic and demographic characteristics, and other differences across regions. Part of the reason that the Regional Transportation District in Denver raised more sales tax revenue than Pima County is because the tax rate in Denver was double the tax rate in Pima County. But that was not the only reason. Denver is also a much bigger economic area. In 2022, the Denver RTD metro population was near 3.6 million, while Pima County’s population was around one million. Further, per capita income in 2022 in Denver was roughly 50% higher than per capita income in Pima County.
Let’s take a closer look at revenues across regions and try to account for differences in population and income. First, we can control for the impact of population size by calculating per capita revenue. Figure 4 shows the results. Revenues in 2022 were highest in Salt Lake City, at $351.5 per person, and lowest in Pima County, at $104.7 per person. Revenues in Maricopa County were $145.9 per person. Notice that jurisdictions with lower sales tax rates tended to have lower per capita revenues, with the exception of Clark County, Nevada. More on that later.
Figure 4: Transportation sales tax revenues per capita in 2022
Revenues per capita may differ across regions because income varies significantly across regions. Note that the ranking of per capita revenue is different than the ranking for per capita personal income. Figure 5 shows transportation tax revenues per $1,000 of personal income in 2022. Revenues in 2022 were highest in Salt Lake City at $5.30 per $1,000 of income. Revenues were lowest in San Diego County at $1.68. Revenues per $1,000 of income in Tucson were $1.92, while revenues were $2.30 in Maricopa County. Again, Clark County, Nevada, with the lowest sales tax rate, posted relatively high revenues per $1,000 of personal income.
Figure 5: Transportation sales tax revenues per $1,000 of personal income in 2022
Note that even on a per capita or per dollar basis, transportation sales tax revenues differed significantly across regions. Why might this happen? There are many possibilities. Clearly, differences in sales tax rates are a big part of the story. But they are not the only differences across regions.
Sales taxes rely on sales tax bases, which means that for any given jurisdiction, some items are subject to tax and some are not. These choices vary across regions. For instance, transportation sales tax revenues in Denver include both sales and use taxes. Further, as individuals age, they typically spend more on services like health care which are usually not taxed. Thus, jurisdictions with older populations will experience lower per capita revenues and per dollar of personal income revenues, other things being the same.
In addition, some regions depend on tourism more than others, which can boost taxable sales per capita and per dollar of income. This is likely a major reason for the strong revenue performance of Clark County, Nevada (Las Vegas).
Within Arizona, we might expect per capita and per dollar revenues to be similar. For Maricopa and Pima counties, revenues are fairly similar once we account for differences in population and income. The remaining differences might be related to different exposure to tourism, differences in the availability high-cost luxury and industrial items, and other differences.
Even after adjustment for population and income, and comparing similar time periods, revenue for Pinal County remains low. In part, this reflects the fact that sales are for fiscal year 2022 and that the relevant sales tax base is narrower. It includes only retail sales and the tax is levied on the first $10,000 for individual items. This matters for sales of big-ticket items like vehicles.
In addition, the difference may reflect Pinal County’s strong economic and commuting connection with Maricopa County. Pinal County residents likely do more shopping in Maricopa County than Maricopa County residents do in Pinal County. Further, Maricopa County probably benefits more from tourist expenditures than does Pinal County.
Use the drop-down menu below to view a summary of each region included in this analysis.
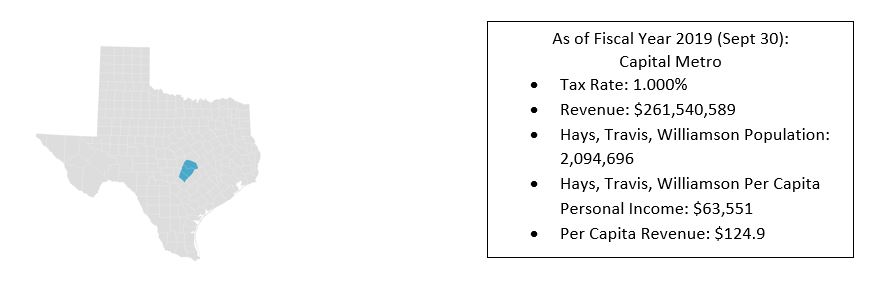
Austin, Texas
Austin, Texas
The greater Austin region, also known as the Austin–Round Rock–San Marcos metropolitan statistical area (MSA) is located in central Texas, and includes the following five counties: Bastrop, Caldwell, Hays, Travis, and Williamson.
Three of these counties, Hays, Travis, and Williamson, belong to the Capital Area Metropolitan Planning Organization (CAMPO) and Central Texas Regional Mobility Authority, an independent government agency created in 2002 to improve the transportation system in Williamson and Travis counties.
Capital Metro was established by a voter referendum in 1985 and is funded in part by a 1.0% sales tax levied by members of its service area. Not all jurisdictions in the three-county area collect the sales tax. Instead, they contract for services. According to Capital Metro, there are 1.3 million residents in the service area.
The relevant sales tax base includes retail sales, leases, and rentals of most goods, as well as taxable services, like amusements, cable television, data processing debt collection, insurance, internet, personal services, telecommunications, and others.
Texas State Law allows local jurisdictions to charge a combined sales tax up to 2%, of which the City of Austin is part. The City of Austin receives half of that and has done so since 1968. However, that money goes into the City’s General Fund. Austin Transportation is a self-funded enterprise department.
As shown in the Texas Comptroller’s Sales Tax Rate History, the current 1% transit tax rate has been in place since October 1995. Capital Metro handles collection and disbursement of that revenue, which is collected from its partner cities like Austin, Leander and Manor.
The most recent Annual Financial Report shows revenues from FY 2019, which ended Sept. 30, 2019, on page iii.
Source:
- Capital Metro (https://www.capmetro.org/)

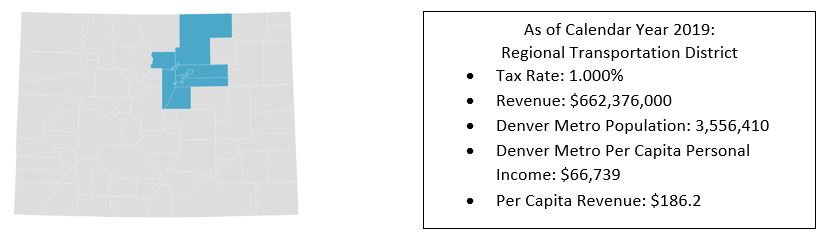
Denver, CO
Denver, Colorado
The City of Denver is the capital of Colorado and has the highest population in the state. The city is named after James W. Denver, who was Governor in 1858 of the Territory of Kansas, which extended from Missouri to the Rocky Mountains. The State of Colorado was part of the Kansas territory at that time. The Denver-Aurora-Lakewood MSA includes 10 counties. The Denver MSA includes Adams, Arapahoe, Broomfield, Clear Creek, Denver, Douglas, Elbert, Gilpin, Jefferson, and Park counties.
The Regional Transportation District (RTD) provides public transportation in eight counties including all of Boulder, Broomfield, Denver, and Jefferson counties, parts of Adams, Arapahoe and Douglas counties, and a small portion of Weld County. The RTD was created in 1969 by the Colorado General Assembly to focus on regional transportation planning. In 1973 voters approved a 0.5% sales tax initiative which has helped to finance a $1.56 billion multimodal transit system and expand routes, acquire private bus companies and improve service throughout the Denver metro area. Today, sales and use tax is RTD’s primary revenue source.
Source:
- Denver Regional Transportation District (https://www.rtd-denver.com/financials-investors)
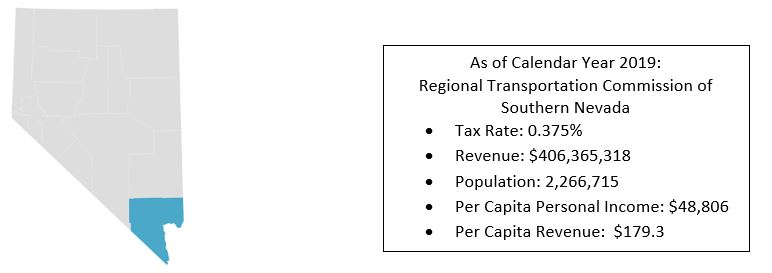
Las Vegas, NV
Las Vegas, Nevada
The City of Las Vegas, Nevada, is the county seat for Clark County, Nevada, which anchors the Las Vegas-Henderson-Paradise, Nevada MSA. The area is a leading cultural, commercial, and financial center for Nevada, and the city is known for being a global entertainment center, famously known for its casino hotels and activities.
The Regional Transportation Commission of Southern Nevada (RTC) oversees funding and planning for transportation, roadway, traffic and construction projects in the region. It manages the funding distribution from the Federal Highway Trust Fund, Federal Transit Administration (FTA) regional, street and highway construction, county motor vehicle fuel tax, and designated county sales tax for transportation.
Source:
- Regional Transportation Commission of Southern Nevada (https://www.rtcsnv.com/about/financial/budget/)
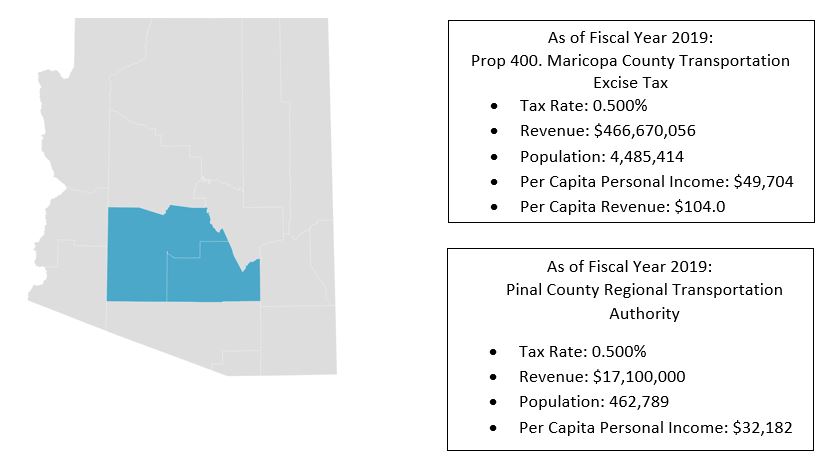
Phoenix, AZ
Phoenix, Arizona
Phoenix is the largest MSA within the Southwest Region. It includes the cities of Phoenix, Scottsdale, and Mesa, and is comprised of Maricopa and Pinal counties.
Maricopa Association of Governments (MAG) developed a regional transportation plan to extend the half-cent Maricopa County excise tax for transportation. The plan, known as Proposition 400, was approved by voters in 2004. The extension, which began in January 2006 expires in December 2025. The Proposition 400 sales tax provides funding for freeways and state highways (56%), public transportation (33%), and improvements for arterial streets (10.5%).
The Regional Transportation Authority (RTA) in Pinal County was established in 2015 by the Pinal County Board of Supervisors as a taxing subdivision for transportation planning, funding and improvement coordination. The Regional Transportation Plan, known as Proposition 416, was adopted in June 2017 and approved by voters in November 2017 to also enact funding for the plan through an excise tax.
Sources:
- ADOT Data for Maricopa County(https://apps.azdot.gov/files/FMS/RARF/Tax/rarf-annual-disclosure-2020.pdf)
- Regional Transportation Authority in Pinal County (http://pinalrta.org/)
- Pinal County RTA data (http://pinalrta.org/wp-content/uploads/2021/03/PRTABoardPacket_March2021.pdf)
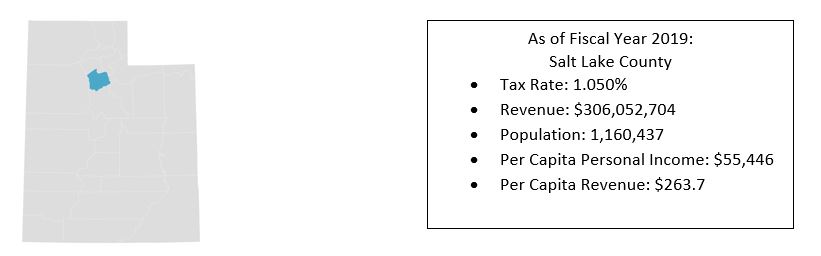
Salt Lake City, UT
Salt Lake City, Utah
Salt Lake City is the capital of the state of Utah as well as the capital seat of Salt Lake County, Utah. The Salt Lake City metropolitan statistical area includes Salt Lake County and Tooele County.
Transportation in Utah is funded through a wide variety of mechanisms, including local option sales taxes. We focus on Salt Lake County and local option sales tax revenues to support transit and transportation infrastructure. To estimate revenues, we multiply the applicable tax rate by county taxable sales published by the Utah Tax Commission.
Sources:
- Utah Sales Tax Revenue Statistics (https://tax.utah.gov/econstats/sales )
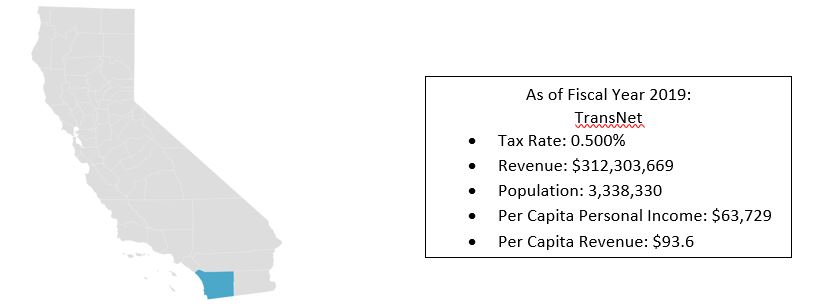
San Diego, CA
San Diego, California
The city of San Diego is the county seat for San Diego County, California, which comprises the San Diego-Chula Vista-Carlsbad MSA. The area sits along the coast of the Pacific Ocean and is known for its affiliation with 16 military installations of the U.S. Coast Guard, Marine Corps and Navy.
The county borders Mexico at the San Ysidro Port of Entry and is part of the largest shared metropolitan area between the United States and Mexico, known as the San Diego-Tijuana transborder metropolitan area.
San Diego County residents approved a 20-year half-cent sales tax in 1987 known as TransNet, to fund various transportation projects in the region. It became one of California’s largest transportation improvement programs. The funds are used for local, highway and transit projects throughout the county and are administered by the San Diego Association of Governments (SANDAG).
Source:
Tucson, AZ
Tucson, Arizona
Pima County, Arizona, is the second largest county in Arizona composed of cities Tucson and South Tucson, and Towns of Marana, Oro Valley, and Sahuarita. The Tucson MSA anchors the Arizona Sun Corridor and is only 60 miles north of the U.S./Mexico border.
Pima Association of Governments manages the Regional Transportation Authority (RTA) which is the fiscal authority of the regional transportation plan, approved by Pima County voters in 2006. The 20-year, $2.1 billion regional transportation plan, which expires in June 2026, uses a half-cent sales tax to fund projects outlined in the plan. The taxing district was established by the Arizona State Legislature.
The RTA has delivered more than 890 projects and services as of spring 2021, which includes transit, roadway, safety, and environmental and economic elements.
Source: