 High Levels of Food Insecurity in Tucson, Arizona MSA
According to a report by the Food and Agriculture Organization of the United Nations World Food Programme, 222 million people in 53 countries/territories will experience acute food insecurity from October 2022 to January 2023. According to a World Bank report, the COVID-19 pandemic caused a major reversal in global poverty reduction. The report also states that, the currently high domestic food price inflation and the ongoing war in Ukraine continue to accentuate the global food crisis.
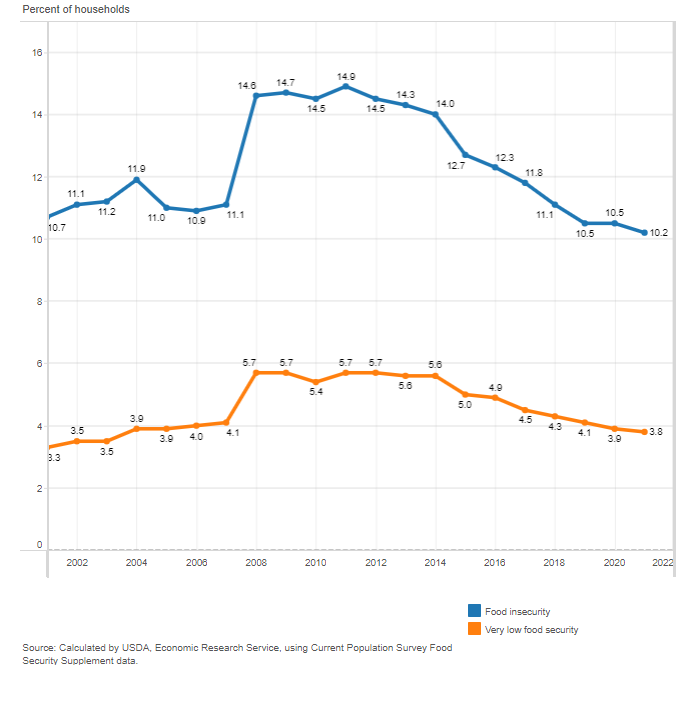
The U.S Department of Agriculture (USDA) estimated that prior to the COVID-19 pandemic, 10.5% (13.7 million) of U.S. households were food insecure. That percentage remained unchanged in 2020 and decreased to 10.2% in 2021. U.S. households with very low food security reached the lowest rate since 2008 at 3.8%. Figure 1 shows the U.S. trend in food-insecure households over the past decade (2001-2021).
Figure 1: Prevalence of Food Insecurity and Very Low Food Security in U.S. Households (2001-2021)
Map the Meal Gap study provides 2020 estimates of food insecurity at the state, county, and district levels. In Arizona, 798,790 individuals, or 11.1% of the population, was considered food insecure during 2020. That ranked Arizona as the state with the third-highest rate of food insecurity among the western states (see Figure 2). Texas had the highest percentage at 13.0%, while Colorado had the lowest at 8.3%.
Figure 2: Percent of Population Food Insecure by State (2020)
Among the metropolitan areas, Colorado Springs had the highest percentage of food insecurity at 15.2% and El Paso the lowest at 8.9%. As illustrated in Figure 3, Tucson shared the second-highest percentage of food insecurity, tied with Albuquerque at 12.6% (one percent less than in 2017). In Tucson, this equated to 131,836 individuals that were food insecure, compared to 527,084 in the Phoenix metro area (10.7%).
Figure 3: Percent of Population Food Insecure by MSA (2019)
Within the state of Arizona, the majority of counties posted higher food insecurity rates than the state (11.1%). Apache was the only county that had a food insecurity rate above 20.0%. Greenlee posted the lowest food insecurity rate at 10.8% (see Figure 4).
Figure 4: Percent of Population Food Insecure by Arizona County (2020)
An additional measure of food insecurity is access to food. In 2019, the state of New Mexico reported that 13.0% of its population had limited access to healthy foods, ranking it first among western states. New Mexico’s rate was more than four percentage points higher than the next state, Arizona, which had 8.7%. That may be due, in part, to the rural nature of the state and its generally low income. Among the western states, California posted the lowest percentage of the population with limited access to healthy foods at 3.2%.
The metropolitan areas compared in this article ranged between 2.5%-10% with regards to limited access to healthy food, with Tucson’s rate at 8.9%. Among the Arizona counties, wide variation existed with a low of 5.5% for Maricopa and a high of 35.3% in Apache (see Figure 5). This variation was driven by the vast differences in rural vs non-rural areas in Arizona and differences in income across the region.
Figure 5: Percent of Population with Limited Access to Healthy Food (2019)
In 2020, all Arizona counties reported food insecurity rates that were higher for the Hispanic and Latino population than for the white, non-Hispanic population. Santa Cruz reported a rate that was 13.0 percentage points higher for the Hispanic and Latino population. Greenlee reported the smallest difference with a rate that was 4.0 percentage points higher for the Hispanic and Latino population. Before the COVID-19 pandemic, the average in those racial disparities was a 5.7% point difference and rose to 8.0% in 2020. Figure 6 highlights the differences in food insecurity rates between the white, non-Hispanic population and the Hispanic and Latino population for the Arizona Counties.
Figure 6: Food Insecurity by Race and Ethnicity in Arizona Counties (2020)
Food Insecurity Projections
Feeding America estimated the national food insecurity rate at 10.9% before the pandemic. Their latest set of projections estimated that in 2021, the national rate of food insecurity was 12.9% - down from 13.9% in 2020. Thus, in 2021, the number of food-insecure people increased by approximately 6.8 million since 2019. The national food insecurity for the child population was 14.6% million in 2019, and was projected to be 17.9% million in 2021.
According to Feeding America, significant racial disparities in food insecurity for Black communities existed before COVID-19 that did not diminish in 2021. Before COVID-19, the difference in food insecurity between Black and white individuals was estimated at 9.7 percentage points. In 2021, that difference rose to 10.2 percentage points. Regionally, the projection of food insecurity in 2021 indicated that this would be highest for households located in rural counties (13.3%), close to the national average in urban areas (i.e., 12.15%).
At the western state level, Texas was projected to have the highest food insecurity rates for the overall population (16.5%) and for children (24.0%) in 2021. Also, New Mexico was projected to have the same percentage of food insecurity for children as Texas, followed by Nevada (23.0%) and Arizona (20.0%). Figure 7 shows the projected rates of food insecurity for the overall population and children in 2021 by state.
Figure 7: Project Rates of Food Insecurity for the Overall Population and Children by State in 2021.
The Healthcare Costs of Food Insecurity in Arizona
In 2016, Feeding America calculated that approximately $52.9 billion in healthcare costs were associated with food insecurity among American adults and children. Those healthcare costs include payments made by private insurers, Medicaid, Medicare, and other sources for clinic and emergency visits, inpatient hospitalizations, prescriptions, and durable medical equipment. Supporting food security across the nation, might reduce healthcare costs and improve population health outcomes.
Annual healthcare costs associated with food insecurity vary by state. Among 10 western states, Texas had the highest cost per capita ($223) associated with food insecurity, followed by Arizona ($196). Colorado had the lowest cost per capita at $127. The annual average healthcare cost per capita among those western states was $165.6 in 2016. Figure 8 illustrates the western state variations of healthcare costs associated with food insecurity per capita.
Figure 8: Health Cost Per Capita Associated with Food Insecurity (2016).
Map the Meal Gap maintains an interactive Supplemental Nutrition Assistance Program (SNAP) Benefits Dashboard where a household budget calculation exploring local cost-of-living and food affordability is provided. For instance, among 141,120 food-insecure people in Pima County, Arizona, 74% may be SNAP eligible. Overall, in 2017, 26 of the 41 Southern Arizona communities reported a higher percentage of SNAP assistance for households than the U.S. rate (12.6%). Learn more about it in our Southern Arizona Communities Income and Earnings Report 2021.
In general, food insecurity in 2021 showed an improvement relative to 2020 in most places. However, the economic effects of the COVID-19 pandemic are far from over and, compounded with rapid inflation, means that millions of American families are still at risk of becoming food insecure.


