There are many ways to evaluate economic performance. Three key dimensions are innovation, inclusion, and growth.
Innovation is a key driver of economic progress. It generates new products and new ways of producing goods and services. One way to measure innovation is by labor productivity. The Brookings Metro Monitor features one such measure for the 192 largest U.S. metropolitan areas in the U.S. It estimates the economy’s overall productivity by dividing Gross Metro Product (GMP) by the total number of jobs.
In Tucson, productivity increased by 2.2% between 2009 and 2019. That ranked Tucson 41st among large metropolitan areas. Figure 1 below illustrates how Tucson compared to peer western metros in output per job. Tucson’s increase in productivity ranked it seventh among peers. Austin’s productivity increased by 13.8% between 2009 and 2019, while Las Vegas posted a decrease in productivity of 5.7%.
Figure 1: Percent Change in Productivity (2009 -2019)
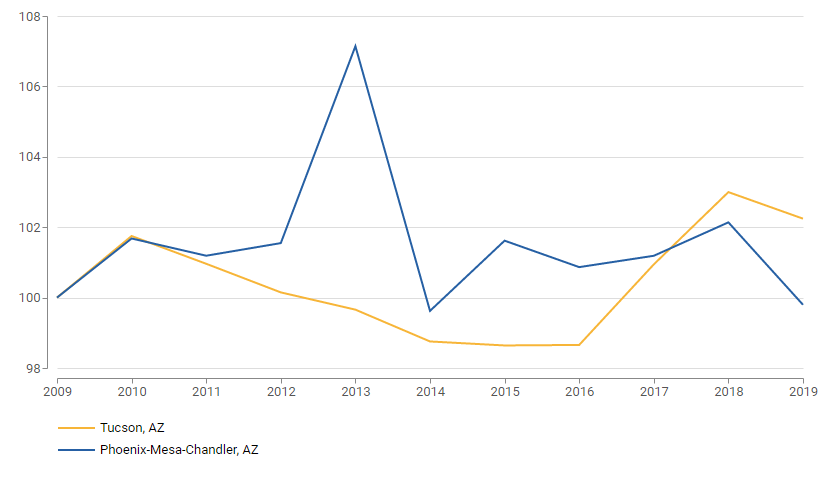
Tucson and Phoenix both showed significant variation in productivity when comparing the annual data between 2009 and 2019. In 2010, both Tucson and Phoenix posted increases in productivity as illustrated in Figure 2. Tucson’s productivity then fell each subsequent year until 2016 when productivity began to increase. Phoenix’s productivity, on the other hand, showed substantial volatility with a sharp increase between 2012 and 2013, which was followed by a steep decline. Productivity in Phoenix then increased through 2018 but fell back to just below the base year (2009) productivity levels in 2019.
Figure 2: Output per job (2009 = 100)
While productivity and innovation are important indicators of economic progress, they miss some key aspects of economic performance. For instance, we also care about the distribution of economic performance across regions and race and ethnic groups. The Brookings Metro Monitor provides a set of measures of inclusion that help illuminate performance in Tucson.
Racial inclusion on the Metro Monitor measures the gap between the non-Hispanic white population and people of color. The following indicators are included in the racial inclusion measure: median earnings, relative poverty, and the employment rate.
Geographic inclusion indicators measure changes in the gap between the most advantaged (top 20%) and least advantaged (bottom 20%) of census tracts in each metropolitan area for the following indicators: employment rate, median household income, and relative poverty rate.
Overall, Tucson ranked relatively well in the Metro Monitor’s racial inclusion index placing 13th among the 53 largest metros. When compared to Tucson’s large peer western metros, it fell behind San Antonio and Denver but ranked better than San Diego, Austin, Las Vegas, Portland, Phoenix, and Salt Lake City. The Metro Monitor breaks metros into three categories: very large, large, and midsized. Several of Tucson’s peer metros fall into the large category.
As for geographic inclusion, Tucson did not place as well among the 53 largest metros. Tucson ranked 21st and fell behind San Antonio, Denver, and Salt Lake City when compared to the large peer western metros.
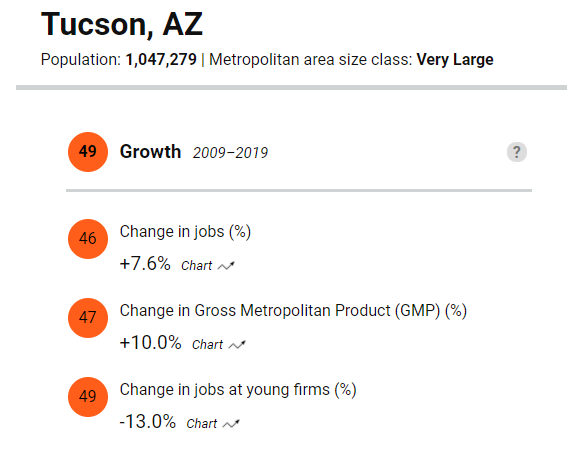
The third dimension of economic performance is growth. Fast-growing regions tend to be dynamic and generate more economic opportunities for residents than slower-growing regions. While Tucson ranked relatively well in the geographic and racial inclusion measures, it did not fare well in the overall growth index. Tucson ranked 49th out of 53 large metros when measuring the change in the size of the economy and entrepreneurial activity. On the Metro Monitor, the measures included in the overall growth index are the total number of occupied jobs, the total value of goods and services produced in the metropolitan area, and the number of jobs at young firms. Figure 3 highlights the ranks and values for Tucson’s growth index.
Figure 3:
Brookings recently added a Metro Recovery Index that includes data on a variety of measures to estimate the impact of the pandemic and the trajectory for change. Stay tuned to the MAP Dashboard for an article that explores how Tucson is faring in these measures.


