 Putting Miles on Our Cars: How Far Do People in Tucson, Arizona Drive Per Day
Have you ever wondered how far your fellow Tucsonan drives in a typical day? Or which roads they are more likely to use? Data reported in this article allows us to explore these trends for local areas. The data in this article was provided by the Federal Highway Administration (FHWA) and will be available in Highway Statistics in early 2019. One measure the FHWA reports, Vehicle Miles Traveled (VMT), tracks total travel for all vehicle types for a given region over a specific period of time. VMT is a key metric in transportation planning allowing policymakers to track travel changes over time and among regions, project future congestion levels, and aid in infrastructure investment decisions.1
The FHWA reports VMT by roadway type. Several roadway types will be explored in this article including: interstates, other freeways and expressways, other principal arterials, and minor arterials. Interstates are limited access highways with divided travel lanes. They are designed for long-distance travel, and designated as interstates by the U.S. Department of Transportation. Other freeways and expressways are similar to interstates, but lack designation and may include a limited number of at-grade intersections. Other principal arterials facilitate large traffic volumes, but provide more connectivity to abutting land uses and are less access controlled. Minor arterials serve to connect arterial routes with residential and collector streets.2
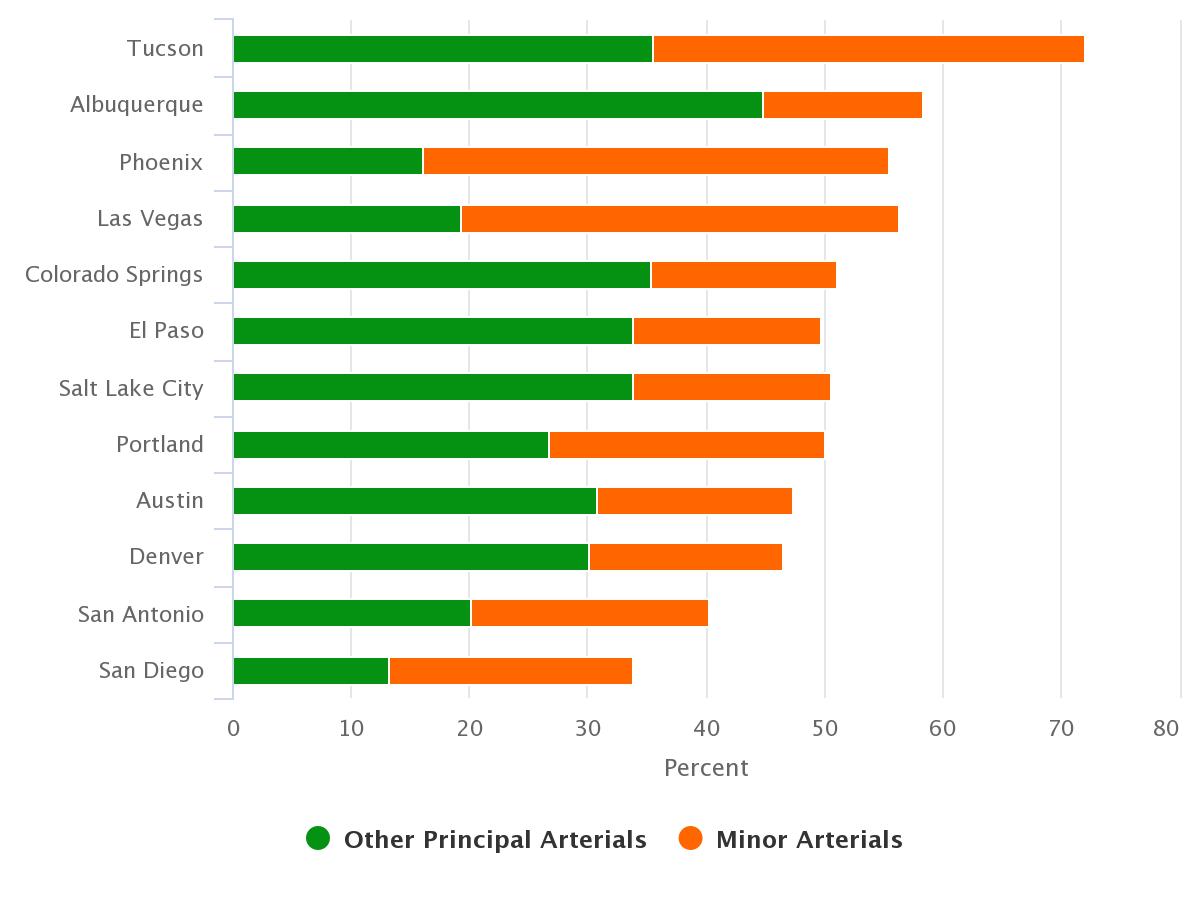
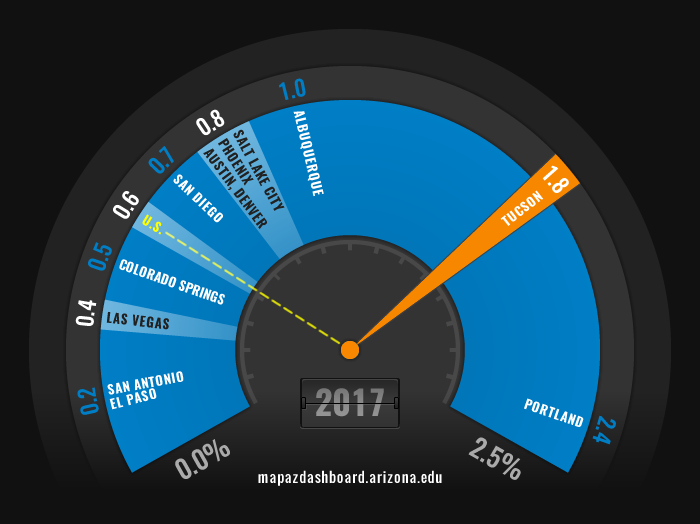
Other principal arterials and minor arterials are particularly important to the Tucson urban area because they account for nearly three quarters of daily VMT in the region. Among 10 western urban areas, Tucson had the highest percentage of daily VMT on both minor and other principal arterials in 2017 (Figure 1). When exploring data for the 494 urban areas in the U.S. we find that Tucson’s percentage of daily VMT on other principal arterials places it 167th, while daily VMT on minor arterials among urban areas is much higher at 72nd or in the top 15%. The Tucson urban area is unique to many of its peer western urban areas because it does not have a cross-town freeway to move traffic off of other arterials roadways and residential streets. Examples of other principal arterials in the Tucson urban area are Grant Road and Broadway Boulevard, while minor arterials include roads like Tucson Boulevard and Pima Street.
Figure 1: Percent of Vehicle Miles Traveled on Other Principal Arterials and Minor Arterials (2017)
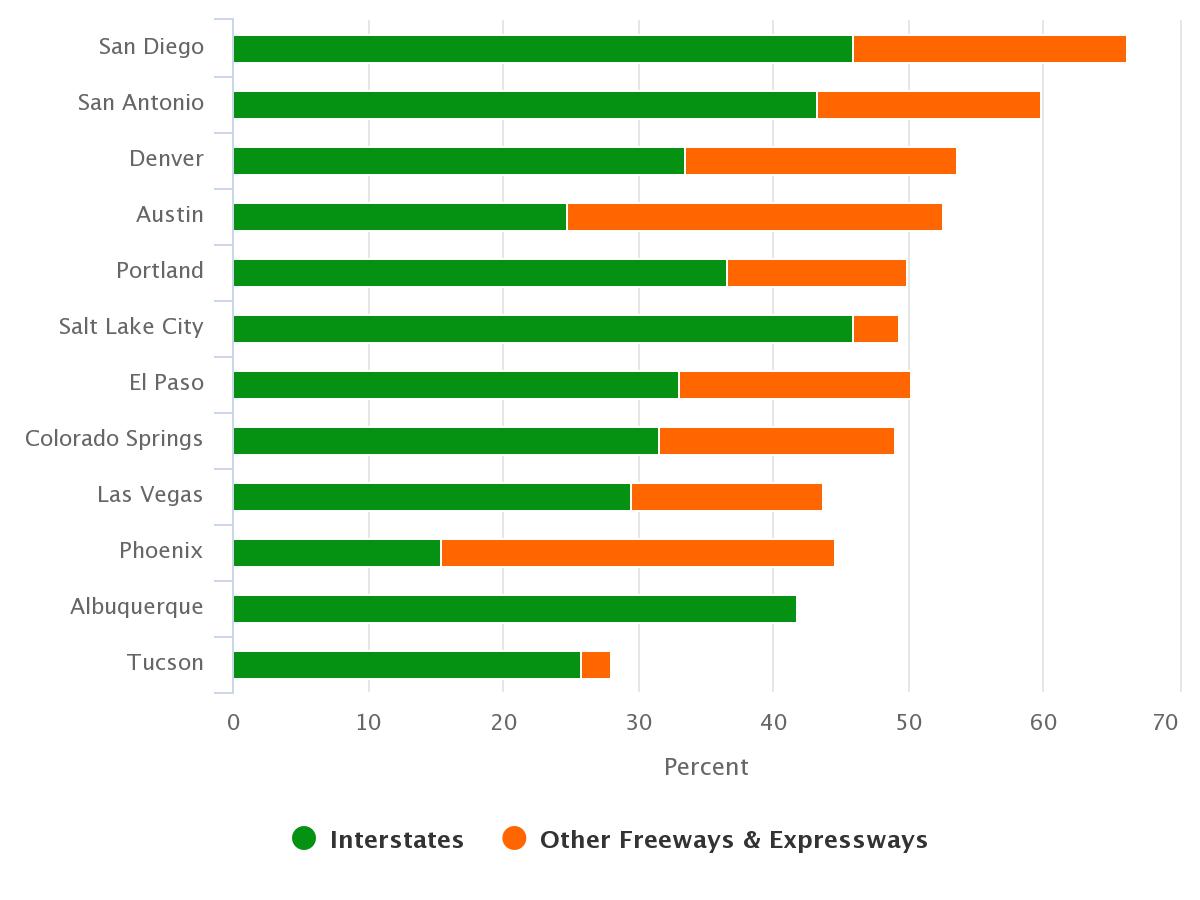
In 2017, Tucson’s combined percentage of VMT on interstates and other freeways and expressways was 27.9%. That was substantially lower than the percentage of VMT on those roadways in other urban areas with Albuquerque at 41.7% and Las Vegas and Phoenix near 44.0%. San Diego had the highest percentage of VMT on interstates and other freeways and expressways at 66.1%. Figure 2 highlights the combined share of VMT on interstates and other freeways and expressways.
Figure 2: Percent of Vehicle Miles Traveled on Interstates and Other Freeways and Expressways (2017)
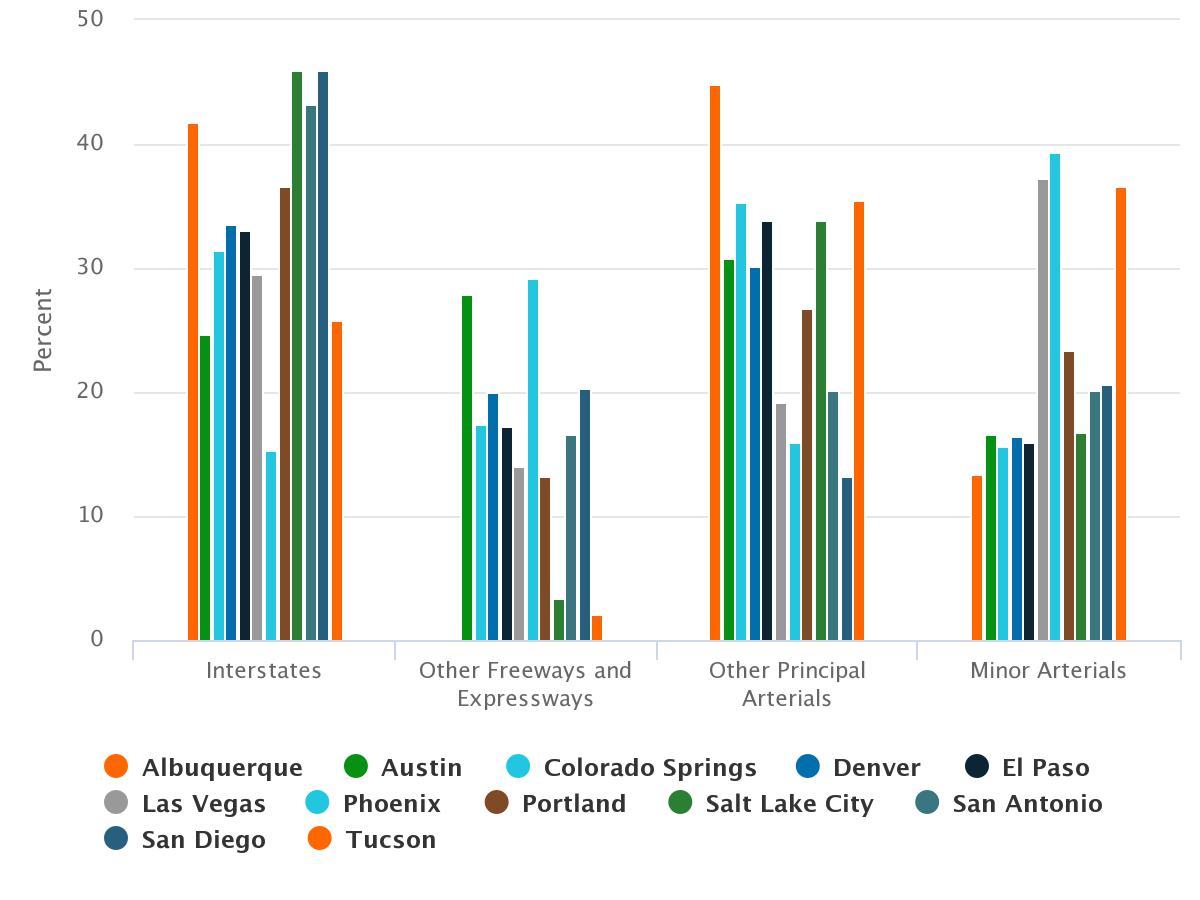
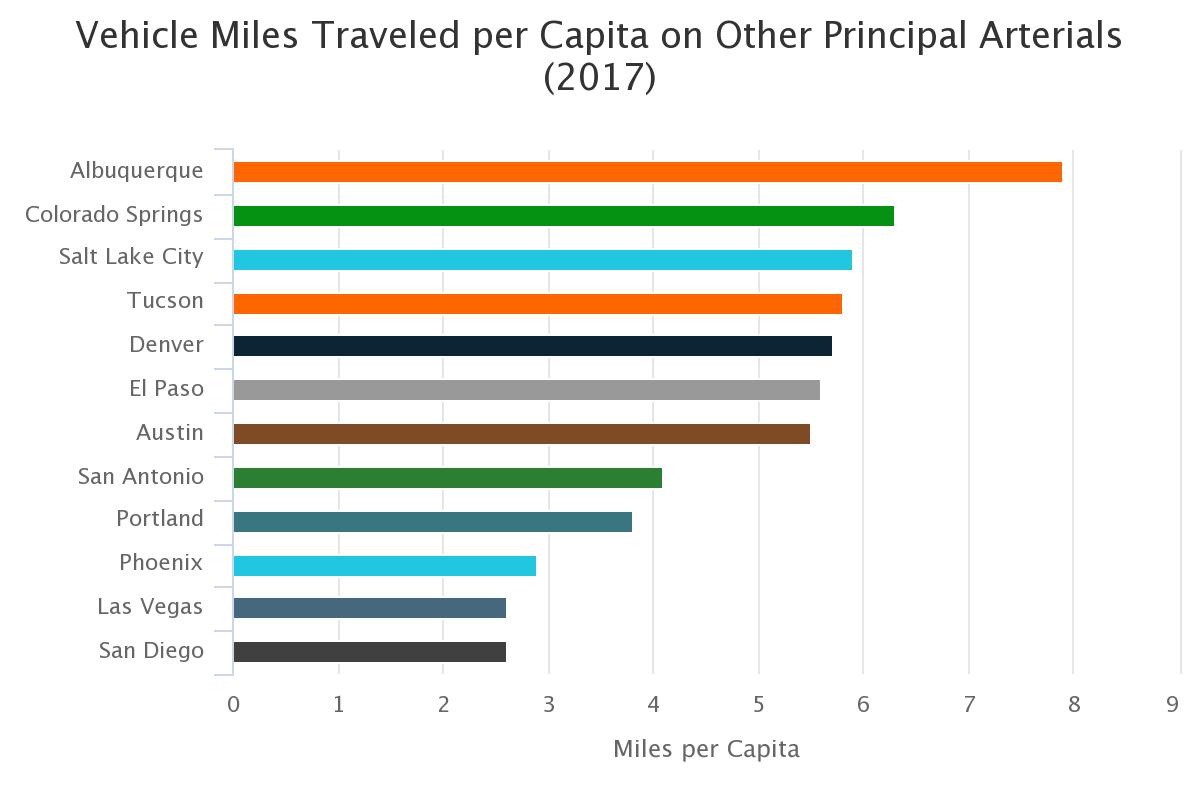
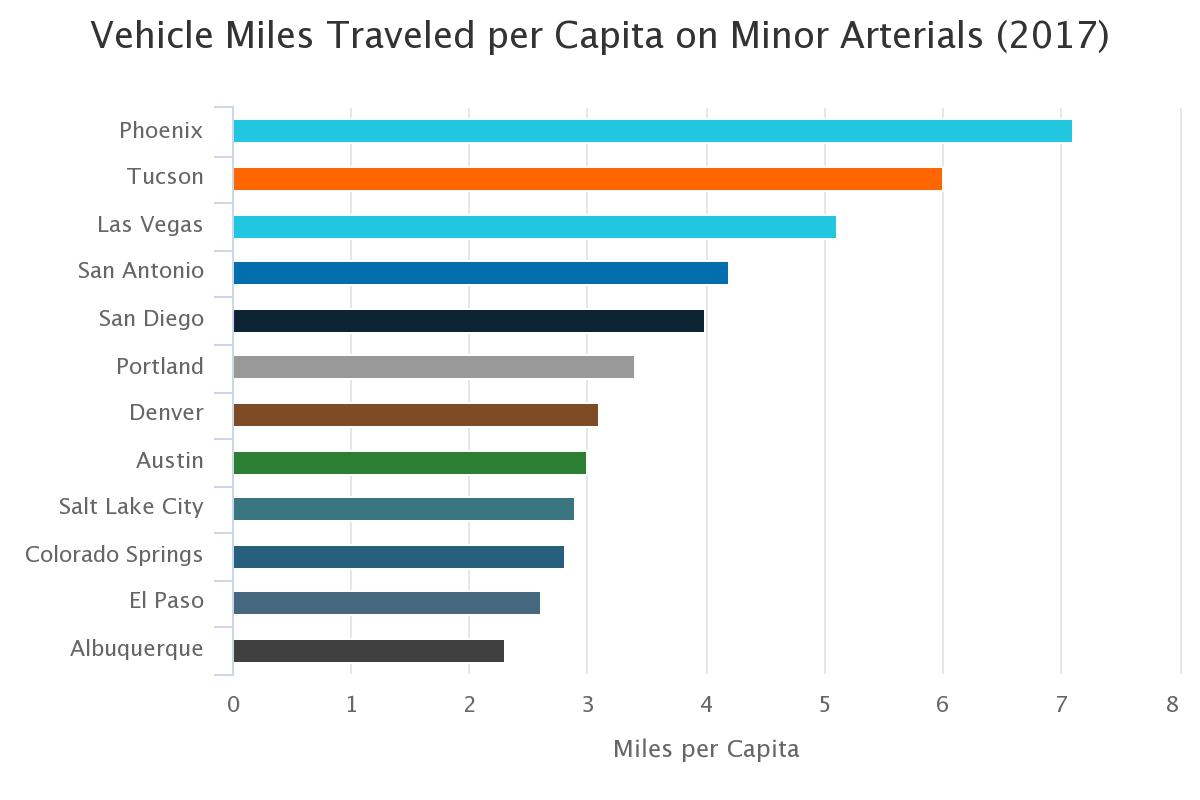
When exploring interstates separate of other freeways and expressways, Phoenix reported the lowest share of VMT at 15.4%, while Tucson and Austin followed near 25.0%. However, Phoenix had the highest share traveled on other freeways and expressways at 29.2%, just ahead of Austin at 27.9%. Tucson reported the lowest share of VMT on other freeways and expressways (Aviation Highway) at 2.1%. Tucson reported the second highest share of VMT on other principal arterials at 35.5%. Vehicle miles traveled in Tucson on minor arterials had a slightly higher volume than other principal arterials at 36.6%, representing the largest combined share among peer western urban areas. Figure 3 illustrates VMT by functional class and for select western urban areas.
Figure 3: Percent of Vehicle Miles Traveled by Road Type (2017)
Why is it important?
Total VMT can help to shape transportation planning and the distribution of public dollars. For example, this occurred through previous federal surface transportation authorization bills like the “Safe, Accountable, Flexible, Efficient Transportation Equity Act: A Legacy for Users”, which allocated 18% of funding to states based solely on VMT. The recent transportation act, Fixing America’s Surface Transportation Act (FAST Act) is the first long-term surface transportation authorization enacted in a decade that provides long-term funding certainty for surface transportation.3 Funding sources for the Arizona Department of Transportation include federal aid, the State Highway Fund, and the Regional Area Road Fund for use in Maricopa County. According to the State of Arizona’s Office of the Auditor the federal aid includes the 18.4 cents per gallon gasoline tax and the 24.4 cents per gallon diesel/kerosene tax, while state highway funds include revenue from various state taxes and the vehicle license tax.4
The federal gasoline tax of 18.4 cents per gallon has remained constant since 1993 and is imposed by all 50 states, while state gas tax rates vary significantly. According to the Tax Foundation, using data from American Petroleum Institute, Arizona’s gas tax rate of 19 cents per gallon was ranked 44th among all 50 states. Langer, et al., notes that increasing Corporate Average Fuel Economy standards, while improving the fuel economy of the nation’s automobile fleet, has led to declines in gas tax revenues per mile, that coupled with the fixed gasoline tax has led to shortfalls in the Highway Trust Fund, which pays for roadway maintenance and improvements.5 She further noted opposition in Congress to raise gasoline taxes when they passed a new five-year transportation bill, the FAST Act, in 2015. One suggestion of the Office of the Auditor in their report is to replace fuel taxes with a VMT tax. Langer et al., suggests that a VMT tax has the potential to generate a more stable stream of revenue than a gas tax because motorists cannot reduce their tax burden by driving more fuel efficient vehicles. The National Surface Transportation Infrastructure Financing Commission has recommended to policymakers that the gasoline tax be replaced with a VMT tax to stabilize transportation funding. Opponents of a VMT tax suggest that it would be costly to implement and manage, and the potential exists for violation of privacy rights. Further, Greene also suggests that a VMT user fee does not encourage energy efficiency in vehicle design, purchase, and operation.6
How do we compare?
VMT per capita varies significantly among Tucson’s peer urban regions. Communities that have strong public transportation systems and are more walkable, like Portland, tend to have lower levels of VMT. According to the Metropolitan Policy Program at the Brookings Institution, dense development promotes more trip chaining (trips may involve one activity, or several activities may be linked together to form a trip chain7), as well as more walking and cycling, which could lead to lower driving per year. Dense development could also minimize the distances between destinations, which would produce more driving on local roadways and less on principal arterials.8
The Tucson urban area had a relatively low daily VMT per capita rates among peer urban areas. Tucson’s daily VMT per capita of 21.3 indicates that each resident drove on average 21.3 miles per day in 2017. Portland had the lowest daily VMT per capita at 18.4. While, two urban areas in Texas, San Antonio and Austin, reported the highest number of daily VMT per person at 24.3 and 24.2 respectively. Figure 4 includes five graphs that highlight the daily VMT per capita by road type for the Tucson urban area and its peer western regions.
Figure 4a-e: Daily Vehicle Miles Traveled per Capita by Road Type
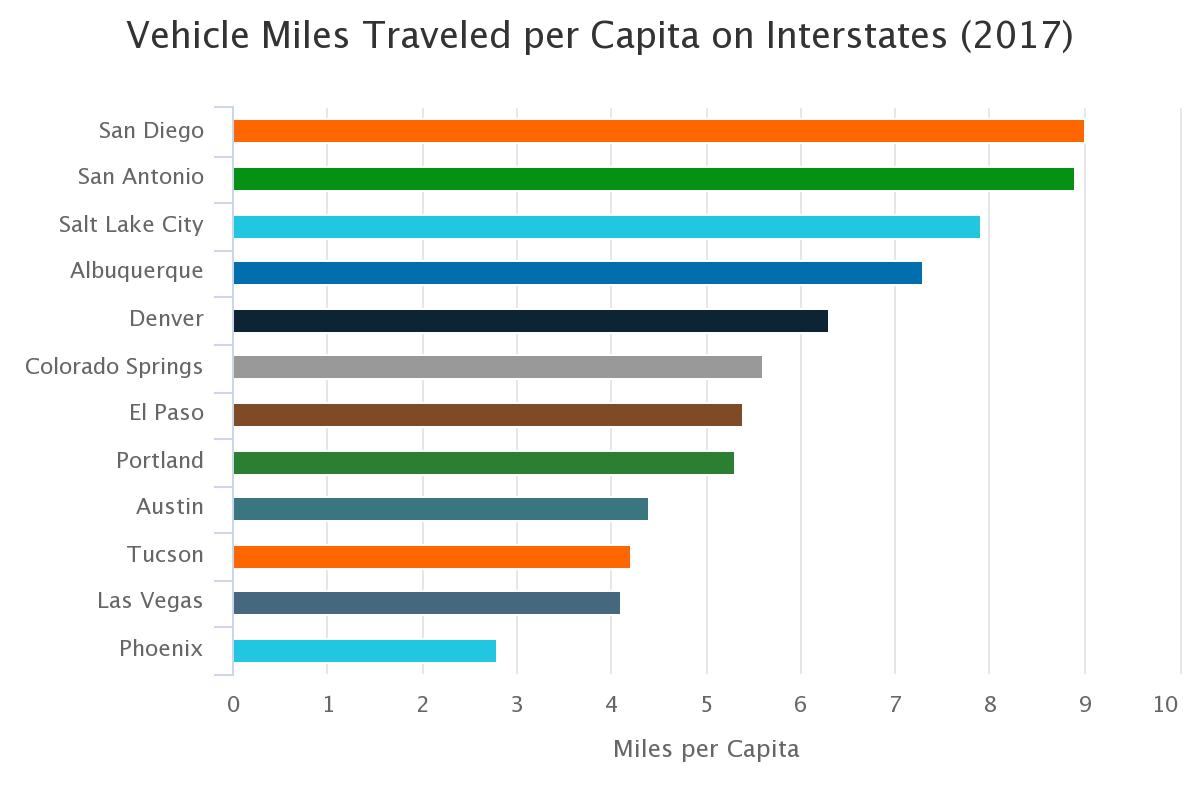
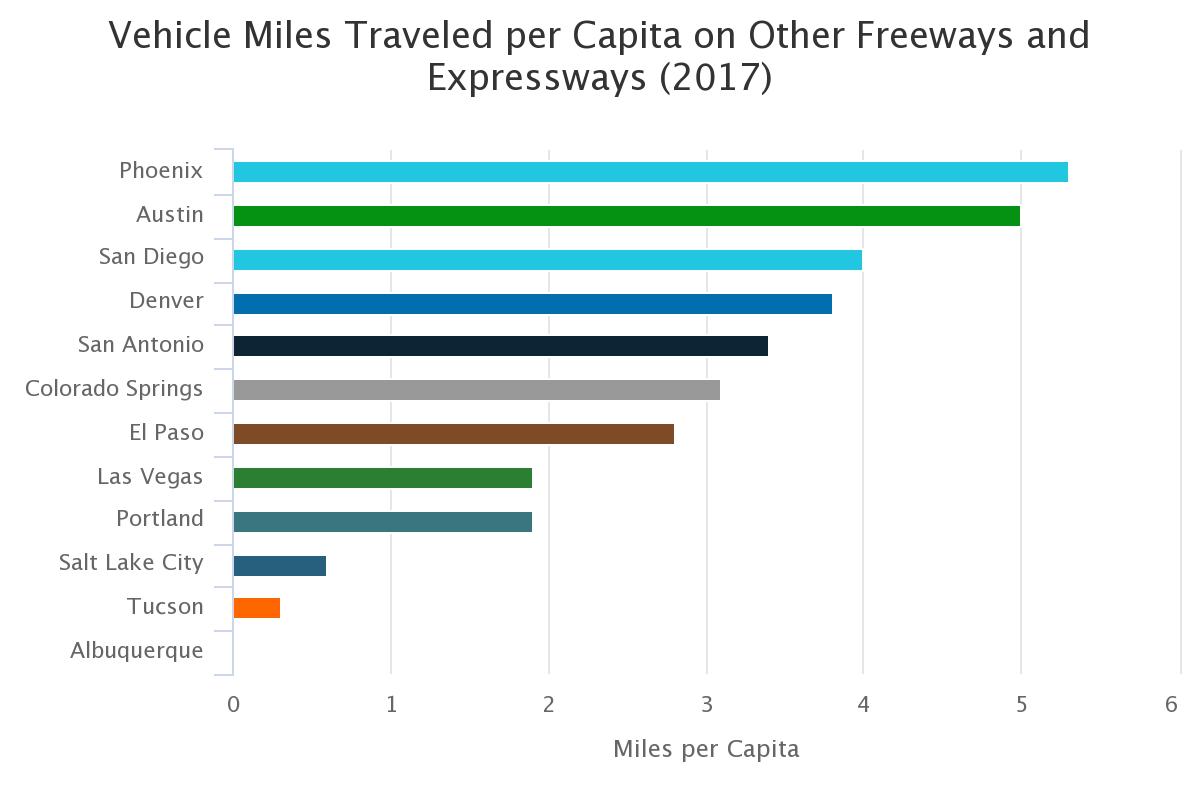
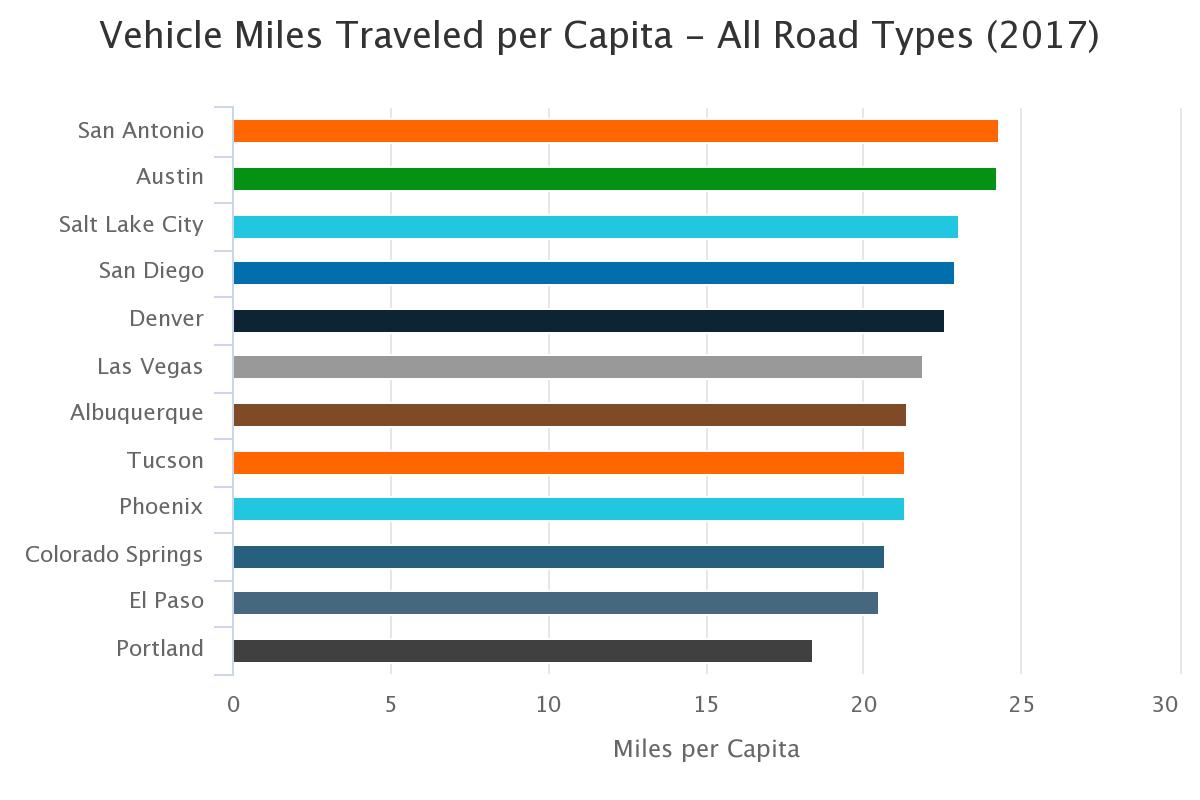
As the graph above illustrates, Tucson reported a relatively low VMT per capita among peer urban areas. Tucson has an extensive network of bicycle friendly roadways and multi-use paths that make it possible to move around the city without a car that may contribute to the relatively low per capita VMT, see the Bicycling Capacity indicator to learn more. Bicycling as a means of commuting is more common in the Tucson Metropolitan Statistical Area (MSA) than in many of its peer MSAs (see Figure 5). Portland which reports the lowest VMT per capita among peer urban areas also has the lowest percentage of those that commute by driving alone and the highest percentage of commuters that bicycle, walk, or use public transportation to get to work. Information on mode of transportation to work can be found in the Transportation to Work indicator on the MAP Dashboard.
Figure 5: Percent of Residents Bicycling to Work (2017) Fuel Gauge
How is it measured?
VMT data comes from the Federal Highway Administration (FHWA). Estimates of VMT are computed for all Federal-aid highways and generated by the Highway Performance Monitoring System (HPMS) software from FWHA. According to FWHA, VMT are a calculated product of annual average daily traffic and the centerline length (in miles) for all sections. VMT can be reported as section-specific results to the desired HPMS aggregation level; for example functional system or urban area. According to the U.S. Department of Transportation, VMT are reported to the FWHA by individual state reports on traffic counts collected through permanent automatic traffic recorders on public roadways. Additionally, VMT data may also be provided through short duration traffic volume counts. Short duration counts ensure that adequate geographic coverage exists for all roads under the jurisdiction of the highway authority according to the FHWA. More information can be found in the Traffic Monitoring Guide.
Federal-aid urbanized areas include, at a minimum, a census designated place with an urban population of 5,000 to 49,999, or a census designated urban area with a population 50,000 or more. Boundaries of federal-aid urban areas may be adjusted to reflect urbanization and transportation needs. Accordingly, they may include densely settled urban areas adjacent to the census designated urban area, as approved by the U.S. Department of Transportation. Urban areas differ from metropolitan statistical areas, which are composed of counties that contain an urban area, as well as adjacent counties that meet certain population density and connectivity requirements.
Population estimates used to calculate VMT per capita come from the Census Bureau American Community Survey one-year estimates.
References:
-
Williams, T., et al. (2016, July) Methodologies Used to Estimate and Forecast Vehicle Miles Traveled (VMT), Texas A&M Transportation Institute, Transportation Policy Research Center, https://static.tti.tamu.edu/tti.tamu.edu/documents/PRC-15-40-F.pdf
-
Highway Functional Classification Concepts, Criteria and Procedures (2013), Federal Highway Administration, United States Department of Transportation, http://www.fhwa.dot.gov/planning/processes/statewide/related/highway_functional_classifications/fcauab.pdf
-
Office of Policy and Government Affairs. (2016, July) Fixing America’s Surface Transportation Act, Federal Highway Administration, United States Department of Transportation, https://www.fhwa.dot.gov/fastact/
-
Davenport, D. (2015, September) Arizona Department of Transportation: Projected Transportation Revenues Fall Short of Estimated Needs and the Arizona Legislature Should Consider a Task Force to Study Options for Addressing Transportation Revenue Needs, A Report to the Arizona Legislature, State of Arizona Office of the Auditor General, https://www.azauditor.gov/sites/default/files/15-113_Report_0.pdf
-
Langer, A., Maheshri, V., and Winston, C. (2017, May) From gallons to miles: A disaggregate analysis of automobile travel and externality taxes, Journal of Public Economics, https://www.brookings.edu/wp-content/uploads/2017/06/jpube-vmt-paper.pdf
-
Greene, D. (2011) What is greener than a VMT tax? The case for an indexed energy user fee to finance us surface transportation, Transportation Research Part D, https://www.sciencedirect.com/science/article/pii/S1361920911000630
-
Primerano, F., Taylor, M.A.P., Pitaksringkarn, L. et al. (2008, January) Defining and understanding trip chaining behavior, Transportation, https://link.springer.com/article/10.1007/s11116-007-9134-8
-
Puentes, R. and Tomer, A. (2008, December 16) The Road Less Traveled: An Analysis of Vehicle Miles Traveled Trends in the U.S., Metropolitan Policy Program at Brookings, https://www.brookings.edu/research/the-roadless-traveled-an-analysis-of-vehicle-miles-traveled-trends-in-the-u-s/


