 People with Disabilities: Poverty and Health Care Costs in Tucson, Arizona MSA
In the first and second articles of the disability series, we explored how disability status in the US, Arizona, and the Tucson Metropolitan Statistical Area (MSA) relates to educational access and attainment, employment opportunities, and earnings. This third and last article explores how the multifaceted nature of poverty and access to the healthcare system are interrelated and how their intimate connection to education, employment, and earnings combine to affect the disabled community.
Poverty
Disability can often lead to socio-economic instability through job loss, reduced earnings, substantial disability-related costs, and barriers to education and training. As highlighted in the Economic Justice Is Disability Justice report by the Century Foundation, disability can also be a consequence of economic insecurity because poverty and economic instability impede access to health care and increase the likelihood of living and/or working under unhealthy conditions.
According to a report by the National Disability Institute, disability and poverty reinforce each other, contributing to increased vulnerability and exclusion. Tracking these data can provide policymakers information on people with disabilities who are living in poverty, allowing for decisions that will mitigate and ultimately alleviate this situation.
In 2022, the poverty rate of individuals with disabilities aged 18-64 years in the U.S. was 24.9%, while the poverty rate of individuals without disabilities was 10.2%- a difference of 14.7 percentage points (Figure 1). The poverty gap was smaller in Arizona and Tucson compared to the nation, where the differences were 11.7 and 10.8 percentage points, respectively.
Figure 1: Poverty Rate by Disability Status for 18-64 Year Olds (2022)
Individuals age 65 years and over with disabilities experienced lower poverty rates in Arizona (12.7%) and Tucson (12.0%), compared to the U.S. (13.8%). In Tucson, the poverty rate for the working-age population (18-64 years) was 2.3 percentage points higher than the state (22.9%). In 2022, people with disabilities in Arizona experienced lower poverty rates across all age groups compared to their counterparts in the United States (Figure 2).
Figure 2: Poverty Rate Among People With Disabilities by Age Group (2022)
Healthcare
As maintained by the Centers for Disease Control and Prevention (CDC), people with disabilities face many barriers to good health. They are more likely than people without disabilities to report having poorer overall health, have less access to adequate health care, and more frequently engage in risky health behaviors such as smoking and physical inactivity.
According to the National Disability Institute, adults with disabilities are less likely to lack health insurance than those without disabilities because they are much more likely to be covered by Medicare or Medicaid. Medicare provides medical health insurance to people under 65 with certain disabilities and any age with end-stage renal disease (permanent kidney failure requiring dialysis or a kidney transplant), resulting in a high rate of coverage. Nevertheless, they are more than twice as likely to have difficulty paying their medical bills. These bills may be the result of out-of-pocket expenses for co-payments and deductibles or uncovered services.
In 2022, 89.1% of individuals with disabilities in Arizona (ages 19-64 years) had health insurance coverage, a higher rate than those without disabilities (84.8%). Those with disabilities had a slightly lower rate of health insurance coverage than their national peers. In the Tucson MSA, health insurance coverage was reported for 89.5% of individuals aged 19-64 with disabilities, which represented a 2.8 percentage point increase compared to individuals without disabilities (Figure 3).
Figure 3: Percentage of the Disabled Population (Aged 19-64) With and Without Health Insurance Coverage (2022)
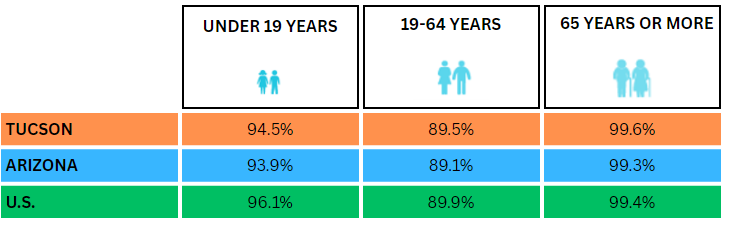
Furthermore, in 2022, both the Tucson MSA (at 94.5%) and the state of Arizona (at 93.9%) had lower health insurance rates for children with disabilities compared to the national average of 96.1% (Figure 4).
Figure 4: Percentage of the Disabled Population With Health Insurance by Age (2022)
Disability Healthcare Costs
As reported by the National Council on Disability (NCD) in the Impact of COVID-19 on People with Disabilities, many people with disabilities excluded from the labor market are in a “poverty trap”; they rely on federal public assistance programs, and cannot work without losing essential healthcare.
In 2015, disability-associated healthcare expenditures (DAHE) for the US totaled $868 billion. That was $340 billion more than in 2003. Of the national total, the DAHE was $324.7 billion for Medicare expenditures, $277.1 billion for Medicaid expenditures, and $266.1 billion for nonpublic sources.
State-level DAHE varied due to differences in demographic characteristics, access to and quality of care, the severity of the disability, the prevalence of chronic conditions, and coverage and payment policies. For instance, in Arizona, the disability healthcare percentage was 37.0% of total expenditures ($14.8 billion). In Utah, the share was 29.0% of total expenditures ($4.8 billion).
The mean State-level DAHE per person with disabilities (PWD) in 2015 was $17,431. Among the 10 Western states, Arizona ranked seventh ($14,326). The highest mean expenditure per person was California ($19,949), followed by Texas ($17,189). Idaho posted the lowest at $14,059. Figure 5 shows the estimated mean expenditures per person for Western states.
Figure 5: Mean Disability-Associated Health Care Expenditures (DAHE) per Person With a Disability (PWD) (2017 Prices) by States
In conclusion, tackling poverty and health inequalities among individuals with disabilities necessitates a comprehensive strategy that takes into account the geographical context, accessibility to healthcare, and socioeconomic aspects. Advocacy efforts, policy reforms, and community backing are pivotal in enhancing the well-being of individuals with disabilities.
Source
Disability status data come from the 2022 American Community Survey (ACS) 5-year estimates published by the U.S. Census Bureau. The Census Bureau changed the way they handled questions on disability in the 2008 ACS, so current data are not comparable to previous ACS releases or to the Census 2000. This article utilizes data from the Centers of Disease Control and Prevention (CDC) and Public Health Report SAGE Journals to estimate healthcare costs.


