The COVID-19 pandemic has had wide-reaching implications worldwide from serious health consequences to increases in food insecurity. The World Bank’s recent brief “Food Security and COVID-19” estimates that 265 million people worldwide could face acute food insecurity by the end of 2020, up from 135 million people before the COVID-19 crisis, because of income and remittance losses.
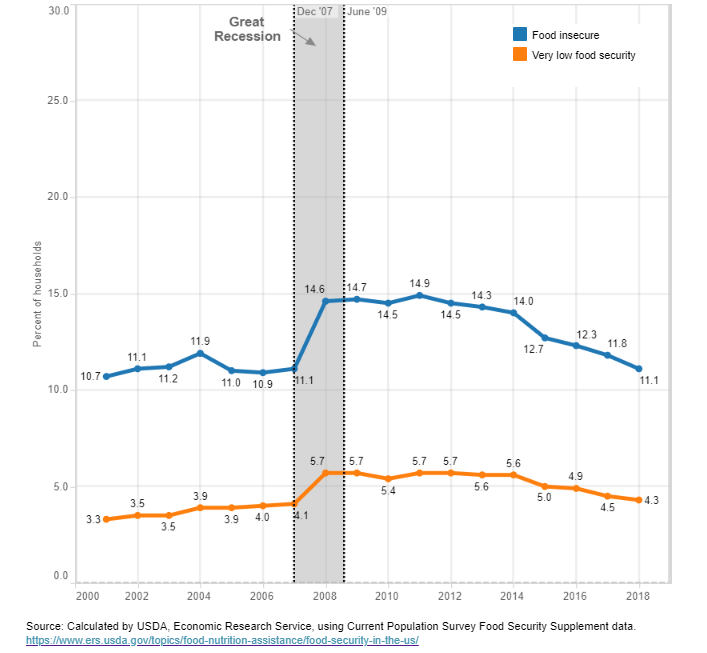
Food insecurity is defined by Feeding America as a household’s inability to provide enough food for every person to live an active, healthy life. Food insecurity is one way we can measure and assess the risk of hunger in the United States. Prior to the COVID-19 pandemic, approximately 14.3 million (11.1%) households in the U.S. were food insecure. This was down significantly from the years following the 2008 recession when food insecurity rates were near 15%. In the U.S., Feeding America estimates that the number of individuals experiencing food insecurity could increase by up to 17.1 million due to the pandemic.
The U.S. Department of Agriculture (USDA) maintains a Food Security Dashboard that provides a wealth of information on the U.S. Figure 1 highlights the U.S. trend on food-insecure households. The USDA dashboard provides data at the household level on the social condition of limited or uncertain access to adequate food. Additional data on the USDA dashboard includes trends by race and ethnicity, and for households with children. In the U.S., Black and Hispanic households have much higher rates of food insecurity than white or other race households.
Figure 1: Prevalence of Food Insecurity and Very Low Food Security in U.S. Households
Food insecurity can have wide-ranging impacts on individuals. Research has shown that food insecurity can cause serious health complications. The article “Food Insecurity and Health Outcomes” published in Health Affairs reviewed the current literature available on the health outcomes of food insecurity. Their review found that food-insecurity can cause a myriad of health problems for children from declines in overall health to birth defects. The article also highlighted studies that have shown that decreased nutrient intake can cause increased rates of mental health problems and depression, diabetes, hypertension, and poor health and sleep outcomes in non-senior adults. Research on seniors demonstrated that food insecurity can cause poor health, depression, and an increased limitation in daily activities when compared to food-secure seniors.
Map the Meal Gap provides state and county-level data on the percentage of the population who did not have access to a reliable source of food during the past year. In Arizona, 979,170 individuals or 14.0% of the population was considered food insecure during 2017. That placed Arizona with the third-highest rate of food insecurity among the western states (see Figure 2). New Mexico had the highest percentage at 15.5%, while Colorado had the lowest at 10.6%.
Figure 2: Percent Food Insecure (2017)
Among the metropolitan areas, Albuquerque had the highest percentage of food insecurity at 14.7% and El Paso the lowest at 9.6%. As illustrated in Figure 3, Tucson had the fourth-highest percentage of food insecurity at 13.6%, while Phoenix fared worse at 13.7%. In Tucson that equated to 137,450 individuals that were food insecure and 625,070 in the Phoenix metro area.
Figure 3: Percent Food Insecure (2017)
Within the state of Arizona, most counties posted food insecurity rates near the state rate of 14.0%. Santa Cruz was the only county that had a food insecurity rate under 10.0%. Navajo and Apache counties both had food insecurity rates above 20.0% (see Figure 4).
Figure 4: Percent Food Insecure (2017)
An additional measure of food insecurity is access to food. The USDA reports data on the percentage of the population who are considered low-income and do not live close to a grocery store. Proximity to a grocery store is defined differently in rural vs non-rural areas. For rural areas, it is defined as living less than 10 miles from a grocery store and in non-rural areas is less than one mile. A family with an annual income of less than or equal to 200 percent of the federal poverty threshold is considered low income for the USDA’s food access measure.
In 2015, the state of New Mexico had the highest percent of the population with limited access to healthy foods at 14.0%. New Mexico’s rate was more than five percentage points higher than the next state. This may be due, in part, to the rural nature of the state and its generally low income. Among the western states, California posted the lowest percentage of the population with limited access to healthy foods at 3.3%.
The metropolitan areas compared in this article ranged between three and 10 percent with Tucson’s rate at 7.7%. Among the Arizona counties wide variation existed with a low of 4.4% for Maricopa and a high of 47.4% in Apache (see Figure 5). This variation was driven by the vast differences in rural vs non-rural areas in Arizona and variance in income across the region.
Figure 5: Percent Limited Access to Food (2015)
The MAP Dashboard will continue to explore the impact COVID-19 has had on food security as more data becomes available. Child food insecurity is a particularly important topic recently as recent data shows that households with children have been negatively impacted by the financial implications of the pandemic. A recent MAP article “How Food-Secure are Tucson’s Children” explored the food security status of children in Tucson.


