 Housing Affordability Bounces Back From Record Lows in Tucson, Arizona MSA
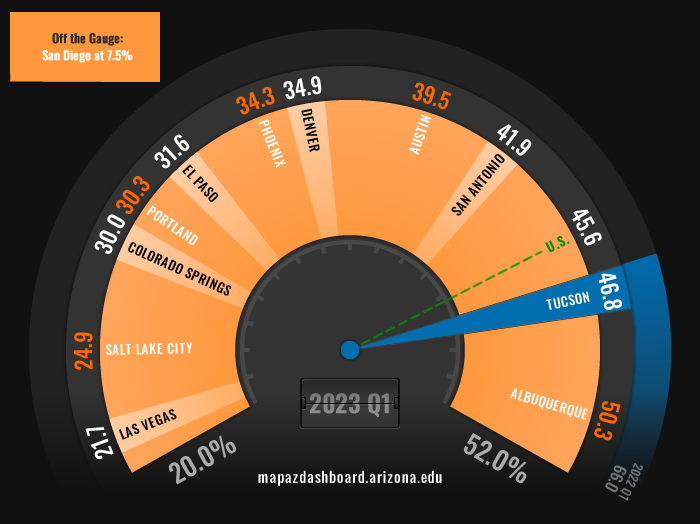
Housing affordability improved in the first quarter of 2023 for the Tucson Metropolitan Statistical Area (MSA) and many of its peers. Tucson ranked second, just behind Albuquerque, with 46.8% of homes sold in the first quarter of 2023 considered affordable to a family earning the local median income (Figure 1). That was an 11.8 percentage point increase from the record low of 35.0% in the fourth quarter of 2022. The improvement in housing affordability was driven primarily by a decline in the median price of homes sold during the first quarter of 2023 and a modest increase in median family income. Despite the improvement in early 2023, Tucson’s housing affordability remained nearly 20 percentage points lower than a year ago. Albuquerque posted the highest percentage of affordable homes at 50.3%, while San Diego had the lowest at 7.5%.
Figure 1: Housing Affordability (2023 Quarter 1)
Housing affordability across all MSAs tracked on the MAP improved during the first quarter of 2023. Austin posted the largest improvement increasing by 18.1 percentage points from a low of 21.4% in the fourth quarter of 2022 to 39.5% in the first quarter of 2023. Tucson fell in the middle of its peer MSAs with an improvement of 11.8 percentage points. Las Vegas posted the smallest improvement, increasing by only 4.5 percentage points between the fourth quarter of 2022 and the first quarter of 2023. As Figure 2 illustrates, the increase in housing affordability during the beginning of 2023 barely made a dent in the declining affordability experienced during 2022. To learn more about why housing affordability declined significantly in 2022, check out the MAP feature “Housing Affordability Plummets in 2022”.
Figure 2: Housing Affordability
Housing affordability is calculated for a given area based on several components including income, housing prices, and interest rates. If home prices increase while income and interest rates remain the same, you would expect a decline in housing affordability. That is what happened in 2021 and the first half of 2022, which drove housing affordability rates to record lows. During the second half of 2022, the housing market began to cool off as interest rates increased. That resulted in the median sales prices of a single-family home declining for many of the MSAs tracked on the MAP Dashboard. Interest rates can play a significant role in affordability, as discussed briefly in the MAP article “Housing Affordability Plummets in 2022".
In Tucson, the median sales prices of a single-family home hit a high of $380,700 in the second quarter of 2022 (Figure 3). That price fell to $362,600 by the first quarter of 2023, a decline of 4.8%. Tucson’s decline in home prices over the last few quarters was one of the slowest among its peer MSAs, with only Albuquerque posting a slower decline at 3.0%. Home prices in Austin fell by 23.7%, while Salt Lake City, Phoenix, Las Vegas, and the U.S. declined by over 10%.
Figure 3: Median Home Price
Declining home prices in the second half of 2022 and the first quarter of 2023, coupled with an increase in the median family income (as reported by the National Association of Home Builders HOI Index), have improved housing affordability in all of the MSAs tracked on the MAP. If home prices continue to decline and income remains stable or increases to match current inflation rates, we may see a further improvement in housing affordability during 2023.
The MAP will continue to explore housing-related data as it becomes available. In the meantime, check out a recent housing-related article on determining how much someone earning the median family income for their area can afford to spend on a house without being considered housing cost burden.


