 Disability Inclusion in Tucson, Arizona MSA
The World Health Organization (WHO) estimates that 1.3 billion people in the world today – or 16% of the global population – experience a significant disability. In 2021, approximately 13.2% of Arizonans reported having a disability. That was 0.6 percentage points higher than the national rate. The percentage of the population with disabilities in Arizona and the Tucson MSA increased by 1.6 percentage points between 2013 and 2021. In 2021, the most common reported disability in Arizona (6.8%) and Tucson (7.7%) was ambulatory disability, followed by independent living at 5.5% in Arizona and 6.4% in Tucson MSA.
This article provides an overview of disability in Tucson and Arizona MSA resulting from the analysis of multidimensional indicators such as prevalence and population (See Table 1), education, economic security, and healthcare system access as well as infrastructure and home environment.
Table 1: Percent of Population with a Disability, by Characteristics (2021)
The overarching purpose of disability inclusion is to provide people with disabilities equal opportunities to participate in everyday activities and to take on roles that are similar to those of their peers who don't have disabilities. Education should be one of the aspects of inclusion that increases participation in socially expected activities.
During the 2020-21 school year, there were 70,580,785 people in the U.S. aged 5 to 21 years enrolled in school, and of these, 6,712,010, or 9.5%, received special education. Among 50 states, Arizona ranked 10th (8.4%) in terms of population receiving special education.
In 2021, compared to 18.7% for the U.S. and 20.6% for the state, the Tucson MSA had a higher percentage of residents with disabilities who hold a bachelor's degree or higher at 24.4%. Although the four-year college attainment rate for Arizonans and residents in Tucson with disabilities is higher than the nation, it is still lower than the population without disabilities, which was 34.0%.
Figure 1: Percentage of Population with Disabilities (25+) by Level of Education (2021). (U.S., Arizona, and Tucson MSA)
Disability can be both a cause and a consequence of socio-economic instability. Often, it leads to job loss, reduced earnings, substantial disability-related costs, and poverty.
In 2021, the poverty rate for people with disabilities aged 18-64 in the Tucson MSA was 25.4%, while the poverty rate for those without disabilities was 14.3%, an 11.1 percentage point disparity. Among people with disabilities, Tucson MSA had a 0.4 percentage point difference above the nation’s poverty rate. In contrast, Arizona had a 1.7 percentage point difference below the nation’s poverty rate. Additionally, individuals with disabilities 65 years and over experienced higher poverty rates in Arizona (49.7%) and Tucson (51.9%), in comparison to the U.S. (13.2%).
Figure 2: Poverty Rate Among People with Disabilities by Age Group in the U.S., Arizona, and Tucson (2021)
In 2021, employment rates were substantially lower for individuals that had a disability (40.8%) compared to those without (76.0%). During the same year, Arizona's employment rate for people with disabilities was 40.8%, which was two percentage points higher than the national average of 38.9%. In 2021, 22.5% of all workers with disabilities in the United States worked in education and health care, 20.9% in Arizona, and 22.6 % in Tucson. Figure 3 shows the employment rates for the disabled population by industry. Click on the drop-down menu to view Arizona or the U.S
Figure 3: Employment Rates for the Disabled Population by Industry (2021)
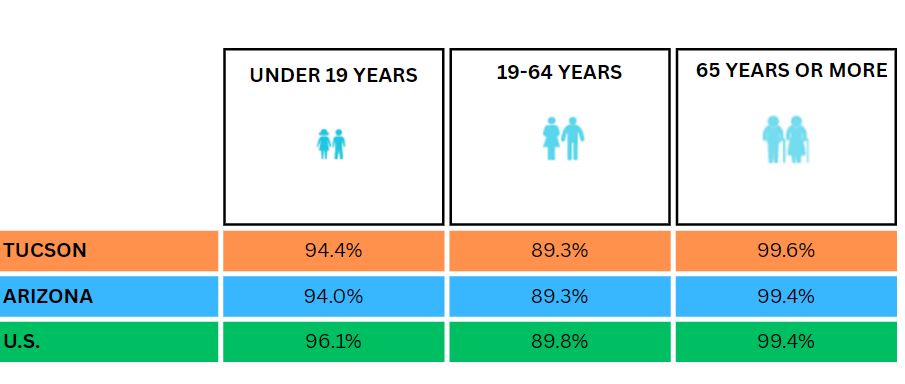
As maintained by the Centers for Disease Control and Prevention (CDC), people with disabilities face many barriers to good health. In 2021, 94.1% of Arizonans with disabilities (ages 18-64 years) had health insurance coverage. That was a difference of 0.3 percentage points less than the nation and the Tucson MSA. In relation to health insurance for children, the Tucson MSA (at 94.4%) and the state of Arizona (at 94.0%) had health insurance rates lower than the nation (96.1%).
Based on the latest Census data, people with disabilities still lag behind their peers without disabilities in terms of income. In 2021, workers with disabilities in the Tucson MSA reported annual median wages of $23,307. These median wages were $10,144 lower than those of non-disabled workers and $3,426 lower than the national average. The annual median wages for workers with disabilities differ significantly by gender. In Arizona, disabled women earned 79.3% of what men with disabilities earned.
Living autonomously and actively participating in society are among the most important values and goals of people with disabilities. However, disabled people currently face a serious housing crisis and the federal programs are failing to meet their needs. In 2021, 13.8% of the population with disabilities in Arizona, lived in poor-quality housing, and 32.8% experienced housing cost burden (compared to 22.7% for individuals without disabilities).
Americans with disabilities depend on the disability workforce infrastructure, which consists of health, education, and social services. In March 2022, the National Highway Traffic Safety Administration (NHTSA) finalized a new rule that improved equity and mobility for drivers and passengers with disabilities. In the year 2021, the Tucson MSA recorded a rate of 66.9% of commuters with disabilities who opted for driving alone as their mode of transportation to work. This figure is nearly seven percentage points lower than that of commuters without disabilities. In relation to public transportation, the percentage of individuals with disabilities utilizing such services was found to be higher at the national level (4.5%) compared to the state of Arizona (2.4%) and the Tucson MSA (3.6%). Figure 4 displays the percentage of commuters with and without disabilities in the U.S., Arizona, and Tucson by modes of transportation. Click on the drop-down menu to view the mode of transportation.
Figure 4: Percentage of Commuters with and Without Disabilities in the U.S., Arizona, and Tucson by Modes of Transportation (2021)
From the data summarized above, it is evident that social and political transformations have ameliorated the living standards and employment prospects for individuals with disabilities. However, it is imperative to persist in implementing sound policy measures, conducting research, and monitoring data to further narrow the disparity between those with and without disabilities. Disability inclusion matters, and everyone in our communities has a role to play in ensuring that disabled people are included and that their lives are improved.
For further insights into the economic security and healthcare system for individuals with disabilities in Arizona, we encourage you to read the second article within this series. To explore data related to earnings, home environment, and infrastructure, we encourage you to read the third article.


