 People with Disabilities: Population, Prevalence, and Home Environment in the Tucson, Arizona MSA
According to the World Health Organization, disability data are essential for countries to be able to develop evidence-based policies to monitor the implementation of the Convention on the Rights of Persons with Disabilities (CRPD), measure progress towards national targets, and take stock of unresolved challenges. The CRPD is an international treaty that identifies the rights of persons with disabilities and the obligations of States to promote, protect, and ensure the rights outlined in the Convention.
This is the first of three articles that explore a multidimensional view of people with disabilities in Arizona. The emphasis of this article lies in highlighting the prevalence of disabled individuals in Arizona, examining the characteristics of their home environment, and shedding light on the population of veterans with disabilities.
The U.S. Census Bureau defines disability as a long-lasting physical, mental, or emotional condition. This condition can make it difficult to perform activities such as walking, climbing stairs, dressing, bathing, learning, or remembering. Disabilities can also impede a person from going outside the home alone or to work.
In 2022, approximately 13.4% of Arizonans reported having a disability. That was 0.5 percentage points higher than the national rate. Tucson had a substantially higher percent of people with disabilities (15.0%) compared to the nation and the state. The percent of the population with disabilities in Arizona and the Tucson MSA increased by 1.8 percentage points and 1.7 percentage points, respectively, between 2013 and 2022, exceeding the US percentage point increase over the same period (0.8) (See Figure 1).
Figure 1: Percent of People with a Disability from 2013 to 2022 in the U.S., Arizona and the Tucson MSA
In terms of gender, Arizona and Tucson MSA showed a higher percent of the population with a disability compared to the entire U.S., for both males and females. However, the percentage of individuals aged 75 and over in the U.S. with a disability (46.9%) was greater than that of the state (44.4%) and the Tucson MSA (43.8%).
Arizona had a lower rate of Black or African Americans and Native Hawaiians with a disability compared to the nation. In 2022, Tucson MSA had a larger percentage of White, not Hispanic or Latino population with a disability, standing at 17.8%. That number exceeded the state’s 15.8% and the national average of 14.1%. (See Table 1 below which provides population characteristics for individuals with a disability in the U.S., Arizona and the Tucson MSA).
Table 1: Percent of Population with a Disability by Characteristic (2022)
Types of Disability
The Census Bureau designates disabilities into six categories: hearing, vision, cognitive, ambulatory, self-care, and independent living. An individual who reports one of the six distinctive types is considered to have a disability. In 2022, Tucson posted higher rates of all types of disabilities than the nation, except self-care difficulty, which equaled that of the U.S. As shown in Figure 2, the most commonly reported disability in Arizona (6.7%) and Tucson (7.6%) is the ambulatory disability, which is defined as having difficulty climbing stairs or walking. That is followed by independent living at 5.6% in Arizona and 6.4% in Tucson. Independent living involves having difficulty doing errands because of physical, mental, or emotional problems. Individuals with cognitive disabilities have difficulty remembering, concentrating, or making decisions because of physical, mental, or emotional concerns. In Tucson, 6.2% of the population reported a cognitive disability. Self-care disabilities are present in 2.6% of Tucson's population and include difficulty bathing or dressing.
Figure 2: Percent of Population with a Disability by Type of Disability (2022)
Arizona Counties
For Arizona counties, the total proportion of the population with a disability ranged from 11.7% in Maricopa to 23.2% in La Paz. When reviewing the disability data in Figure 3, keep in mind the possibility of large margins of error for select counties.
Figure 3: Percent of Population with a Disability in Arizona Counties (2022)
Home Environment
Living independently and being part of the community are among the most important values and goals for people with disabilities. For these individuals, living in their own homes, whether rented or owned, is an essential element of independence.
Federal nondiscrimination laws provide housing protections for individuals with disabilities. The Fair Housing Act, prohibits discrimination in housing and housing-related transactions because of disability status. In the same vein, the Americans with Disabilities Act (ADA), is a comprehensive civil rights law for persons with disabilities. That includes housing protection in cases where the housing is provided or made available by a public entity, regardless of whether the entity receives federal financial assistance.
Despite these laws, disabled people are currently facing a severe housing crisis, and the federal programs are not meeting their needs. As reported by the Urban Institute in the article “People with disabilities living in the U.S. face urgent barriers to housing, “ 18 million disabled people are eligible for federal housing assistance but are not receiving it. Additionally, seven million disabled individuals live with an adult head of household who is a relative, and 52% of those heads of household are 55 or older. Tracking housing affordability data for those individuals remains crucial to ensure appropriate socioeconomic improvements can be implemented to meet their needs.
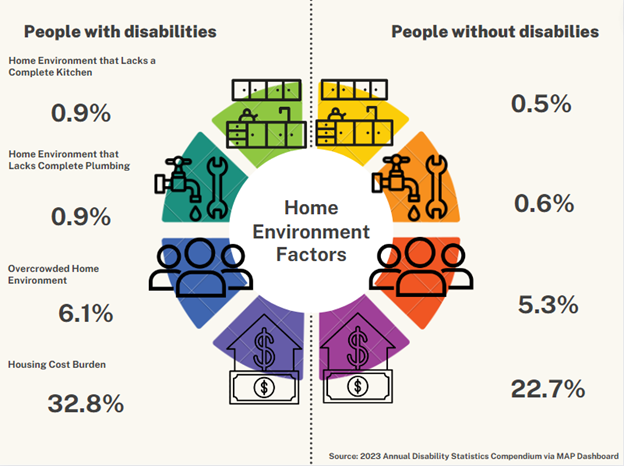
Important home environment factors tracked include housing quality, age of home, and housing type for people with and without disabilities. These housing quality features are displayed in Figure 4, which include the absence of a complete kitchen, the absence of complete plumbing, overcrowding (living in a home with two or more people per bedroom), and cost burden (thirty percent or more of household income spent on housing costs).
In 2021, individuals with disabilities in Arizona experienced more difficulties in all four quality features listed above compared to those without disabilities. For instance, 6.1% of people with disabilities live in an overcrowded environment, compared to 5.3% of people without disabilities. The percent of people with disabilities experiencing housing cost burden was 32.8% compared to 22.7% for individuals without disabilities. Overall, 13.8% of the population with disabilities lived in poor-quality housing (i.e., experienced two of four possible difficulties related to housing quality) in 2021 versus 8.8% of those without disabilities. The infographic below displays the home environment characteristics for people with and without disabilities (18-64 years) in Arizona in 2021.
Figure 4: Characteristics of the Home Environment for People with and without Disabilities (2021)
In 2021, among 10 western states, Arizona ranked second –at 47.9%– in terms of the percentage of the population with disabilities living in housing built in 1990 or later, the year the Americans with Disabilities Act (ADA) was enacted. Nevada ranked first at 55.1%, and California ranked last at 25.8%.
Veteran with Disabilities
Veterans are men and women who have served (even for a short time), but are not currently on active duty in the U.S. Army, Navy, Air Force, Marine Corps, or the Coast Guard. The number of veterans 18 years and older with disabilities since 2013 has risen by more than a million, a 30.7% increase, underscoring the need to allocate special care and support for this group. In 2022, out of 16.8 million people in the United States who were veterans, 5 million (29.8%) had a disability. The percent of veterans with a disability was 15.5 percentage points higher compared to the non-veteran population in the U.S. In Arizona, the percentage point difference between veterans vs. non-veterans with a disability exactly matched the national average. In the Tucson, MSA, the percent of veterans with disability was 14.2 percentage points higher than the non-veteran population (see Figure 5).
Figure 5: Percent of Veterans with Any Disability vs. Non-Veterans with Any Disability (2022)
To learn more about the statistics concerning individuals with disabilities in the Tucson MSA and Arizona, stay tuned for two upcoming articles. These articles will cover topics such as education, employment, and earnings, along with poverty and healthcare costs specifically pertaining to individuals with disabilities.
Disability status data come from the 2022 American Community Survey (ACS) 5-year estimates published by the U.S. Census Bureau. The Census Bureau changed the way they handled questions on disability in the 2008 ACS, so current data are not comparable to previous ACS releases or to the Census 2000. This article utilizes data from the Annual Disability Statistics Compendium to estimate the home environment factors for people with and without disabilities.


