Data on agricultural production, water use across sectors, and regional economies are important to understanding the role of agriculture within regions and states. These data are available from different agencies and databases, but are often presented independently, with limited context. To further these objectives, this collection of county profiles presents agricultural production, water use, and regional economic data for seven Southern Arizona counties. The profiles provide information in a standardized, integrated format to provide context on the role of agriculture within the state and its counties. The profiles also highlight the role of agricultural producers as managers of land and natural resources. The report integrates data from the USDA Census of Agriculture (including the most recent 2017 USDA Census of Agriculture), the Bureau of Economic Analysis, the Bureau of Labor Statistics, Arizona Department of Water Resources, and the U.S. Geological Survey.
Statewide Highlights
• Roughly 90% of Arizona’s population lives in urban areas (2010). Major industries include mining, high-tech manufacturing, business services, and tourism.
• On-farm agricultural production accounts for roughly 1.1% of private employment in Arizona and less than 1% of state GDP (2018).
• Approximately 36% of Arizona’s land area is used for agricultural purposes, either crop or livestock production (2017).
• In Arizona, 77% of water use is for irrigation, livestock, and aquaculture (2015). In western states, it is common for agriculture to represent a relatively small share of state GDP while constituting a large share of total water use.
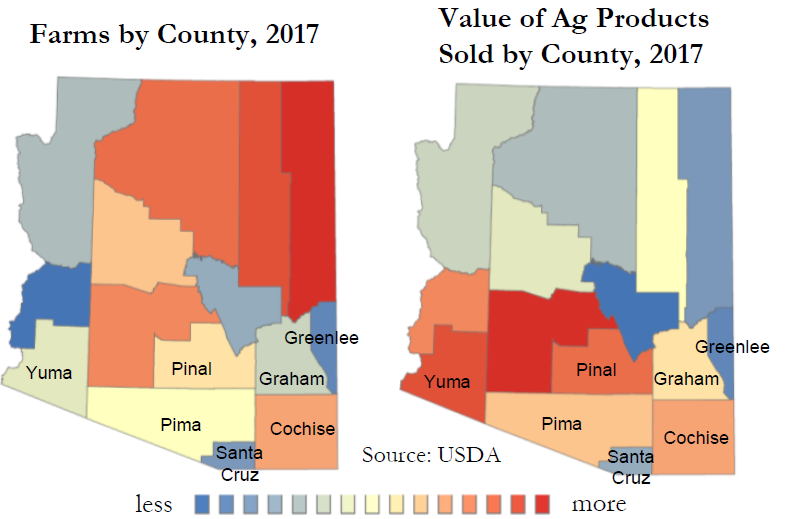
• Agriculture in Arizona is diverse, characterized by highly productive irrigated crop production in the central, western, and southern parts of the state, and by livestock grazing over expansive rangelands in the northern and eastern parts of the state.
• The value of Arizona’s agricultural production is neither crop- or livestock-dominant, but rather value of production of crops and livestock track together in recent years. Within individual counties, the mix between crops and livestock varies considerably.
• Arizona’s top agricultural products by sales include vegetables, melons, potatoes, & sweet potatoes ($1 billion), milk from cows ($856 million), cattle & calves ($641 million) and other crops & hay (largely alfalfa and other hay) ($402 million) (2017).
• Nationally, Arizona ranks highly in the production of broccoli (2nd), cabbage (6th), cantaloupes (2nd), cauliflower (2nd), chile peppers (4th), hay (8th), long-staple cotton (3rd), lemons (2nd), lettuce (2nd), pecans (4th), pistachios (2nd), spinach (2nd), and watermelon (5th)(USDA ERS) (2018). For total value of vegetables and melons sold, Arizona ranked second, after California (2018).
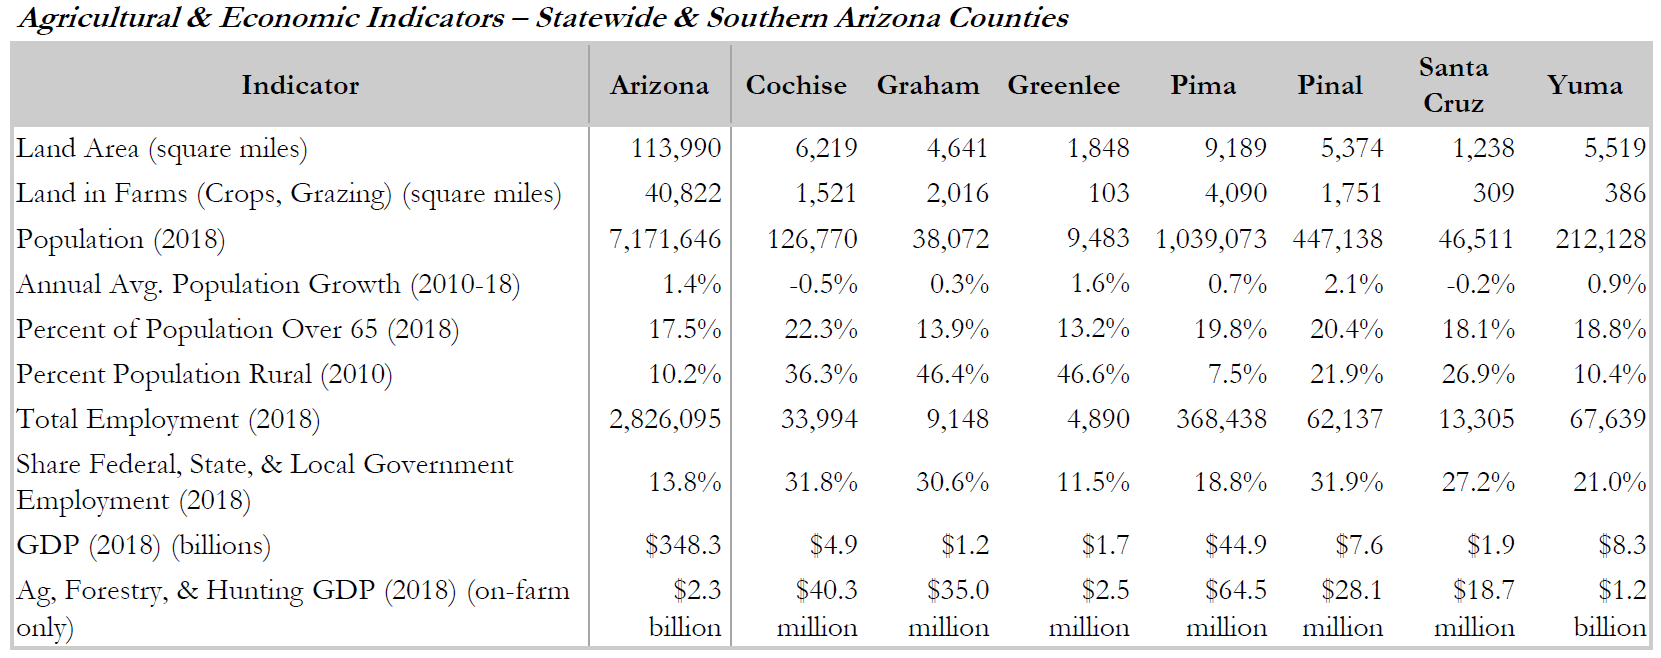
The following table presents high-level agricultural and economic indicators from the state and seven county profiles
County-Level Highlights
Cochise County
• Of the top 10 most concentrated private industries in Cochise County (2018), agricultural industries occupy the top five spots, including tree nut farming, water supply and irrigation systems, hay farming, farm labor contracting, and corn farming. Wineries ranks tenth.
• Cochise County is a center for fruit and tree nut production, particularly pecans, pistachios, and wine grapes. The county is home to two American Viticultural Areas (AVAs) (wine grape-growing regions), the Willcox and Sonoita AVAs. As of 2017, Cochise County had 757 acres of grape production, accounting for roughly half of the state’s total acreage.
Graham County
• Cotton farming is the most concentrated industry in Graham County, with its share of employment 54 times the national
average (2018).
• Though the most common type of farm in Graham County are beef cattle ranches, 88% of county cash receipts originate from sales of crops, and 12% from livestock (2017).
• Major agricultural commodities by sales include cotton & cottonseed ($28.5 million), grains, oilseeds, dry beans, & dry peas ($14.2 million), cattle & calves ($6.8 million), and fruits, tree nuts, & berries (sales data not disclosed) (2017).
Greenlee County
• Top industries in Greenlee County include copper mining and mining-related industries. Agriculture has a small footprint, accounting for less than 1% of all private employment and less than 0.2% of county GDP (2018).
• Greenlee County has a small share of land in farms (6%) and accounts for less than 1% of state agricultural cash receipts (2018).
• The most common type of operation in Greenlee County is beef cattle ranching and farming, with 68 farms (2017).
Pima County
• Agriculture directly contributes $64.5 million to the county’s $44.9 billion economy (2018). While agriculture represents a small share of county GDP, nearly 45% of Pima County’s land area is in farms, either for crop production or grazing (2017).
• Pima County accounts for about 2% of Arizona’s state agricultural cash receipts (2017).
Pinal County
• Pinal County accounts for about one-fourth of Arizona’s state agricultural cash receipts. Major agricultural products by sales includes cattle & calves ($283.2 million), milk from cows ($268.2 million), cotton & cottonseed ($92.0 million), other crops & hay ($79.1 million), grains, oilseeds, dry beans, dry peas ($50.2 million), and vegetables, melons, potatoes, & sweet potatoes ($49.3 million) (2017).
• Pinal County ranks in the top 2% of U.S. counties for the sale of cattle, cotton, other crops & hay, and vegetables & melons (2017).
Santa Cruz County
• The county’s largest private industry is fruit and vegetable merchant wholesalers, accounting for about 10% of total employment and 13% of total wages in the county (2018). The Nogales port of entry, located in Santa Cruz County, is a top port nationally for shipments of fresh fruits and vegetables from Mexico, the U.S.’s top source of imported fresh produce.
• Santa Cruz County has a growing wine industry and is home to the Sonoita American Viticultural Area (AVA).
Yuma County
• Agriculture accounts for more than 14% of the county’s GDP and employs nearly one-fourth of all private industry jobs (2018). Yuma County accounts for about 30% of Arizona’s state agricultural cash receipts (2017).
• Yuma County is the third-largest vegetable and melon producing county in the U.S. with $782.3 million in sales in 2017.
• Yuma County is one of the country’s largest producers of winter vegetables, particularly leafy greens such as Romaine, iceberg, and red leaf and green leaf lettuce.


