 Assessing Student Performance Through Comparative Analysis in Tucson, Arizona MSA
Measuring student achievement is a complicated undertaking. This article touches on three commonly used measures, each with its own strengths and weaknesses.
AzM2 exams are administered every fall and spring in Arizona to test proficiency in English Language Arts and math for students in grades 3-8. Standardized aptitude tests allow schools to measure a student’s knowledge on a broad range of abilities and skills that are often thought of as important for future success in school. Have you ever wondered how students in Arizona compare to those in California or Colorado? Unfortunately, the AZM2 data cannot be used for that purpose.
Test scores are often compared across states using National Assessment of Educational Progress (NAEP) data (Figure 1). NAEP is an ongoing student assessment program conducted by the National Center for Educational Statistics under the U.S. Department of Education. NAEP assessment includes students from across the nation who are selected at random. The data allow for a state-to-state or state-to-nation comparison but not for a more nuanced comparison of school districts, cities, or metros.
Finally, the Stanford Educational Opportunity Project at Stanford University has built the first national database aimed at helping scholars, policymakers, educators, and parents learn how to improve educational opportunities for all children.
The MAP core indicator Student Achievement was recently updated with the 2021 AzM2 data. In 2021, 35.0% of 3rd-grade students in Arizona passed the English Language Arts (ELA) exam, while 27.0% in 8th grade passed the Math exam. In general, student achievement scores declined across the nation during the COVID-19 pandemic. Arizona was no exception, with ELA scores falling by more than 11 percentage points and math scores by five percentage points. The pandemic created a challenging environment for students and educators. The data in 2021 allows us to track where the students currently are and appropriately address the steps necessary for our children’s educational needs as we move beyond the challenges of the pandemic. It’s important to note that the statewide decline was consistent across all races, ethnicities, and genders. However, many minority groups had relatively low standardized test scores before the pandemic.
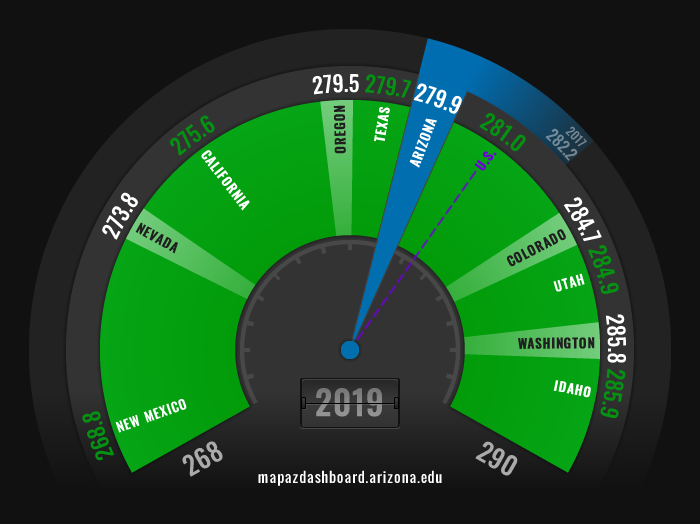
Figure 1 shows the NAEP scores in 2019 for 8th-grade math for students in Arizona compared to the western states. Arizona’s score was slightly behind the nation and placed fifth among the 10 states. The NAEP data is reported every two years. Arizona’s score in eighth-grade math declined slightly between 2017 and 2018.
Figure 1: NAEP Scores for 8th Grade Math
Let’s turn now to the Stanford Education Data Archive (SEDA) results. These are based on the standardized accountability tests in math and Reading Language Arts (RLA) administered by each state to all public-school students in 3-8th grade for the 2008-2009 through 2017-2018 school years. The SEDA data aligns state tests to the NAEP and finds the national average for each grade such that an average score for 3rd grade is a 3.0, 4th is 4.0, etc. The SECA data reports on three aspects of educational opportunity: average test score, learning rates, and trends in test scores.
When exploring the SEDA data across all grades levels and subjects for all of the years of data available, the Tucson Metropolitan Statistical Area (MSA) was approximately half a grade year behind with a score of -0.5. A value of 0 represents the national average for all students, values less than 0 indicate scores below the national average, and values above 0 represent scores above the national average. For example, a -1 would be one-grade level behind and a +1 would be one-grade level ahead. When compared to peer MSAs, Tucson had the third-lowest average score. Albuquerque had the lowest at almost a full grade level behind (-0.9), and Colorado Springs had the highest at nearly a full grade level ahead (+0.8) as illustrated in Figure 2.
Figure 2: Average SEDA Test Scores for Grades 3-8 across All Subjects and Years of Data
When breaking down the average test scores by race & ethnicity in Tucson, the data reported by SEDA is similar to the AzM2 results, with Asians reporting the highest average test score at nearly 1 ½ grade levels ahead (1.4), followed by white, non-Hispanic (0.8). Native Americans in the Tucson MSA reported the lowest average test score at 2 ½ grade levels below (-2.5), followed by Hispanic or Latinos (-1.3) and Blacks (-1.6). These results were consistent across the peer MSAs with Asians or white, non-Hispanics reporting the highest average test scores. However, many MSAs reported significantly smaller gaps between the groups. For example, in Colorado Springs, Asians had an average score 1.6 grade levels ahead, while the lowest scoring group (Blacks) were only half a grade level behind (-0.5).
Figure 3: Average Test Scores for Grades 3-8 across all Subjects and Years by Race & Ethnicity
Females had higher test scores in all MSAs tracked when compared to males. Tucson had one of the largest gaps between males and females. The average test score for females was -0.3, while males had an average test score of -0.8. Figure 4 shows the average test scores for females and males in MSAs tracked on the MAP.
Figure 4: Average Test Scores for Grades 3-8 across all Subjects and Years by Gender
The SEDA data also shows trends over time. Tucson’s scores across all grade levels for Reading Language Arts improved over time. In 2009, Tucson’s average score was nearly a full grade level behind at -0.8. That score slowly improved to just over a quarter of the year behind in 2016 and 2017 (-0.3). Several other peer MSAs also improved between 2009 including Austin, Salt Lake City, and San Diego. Figure 5 highlights the average test score for Reading Language Arts across grade levels between 2009 and 2018. Please note that not all years of data are available for each of the MSAs.
Figure 5: Average Test Scores for Grades 3-8 for Reading Language Arts by Year
Similar trends in math were posted for Tucson. In 2009, the average math score was nearly a full grade level behind at -0.9. However, by 2015 that had improved to only a quarter of a grade level behind (-0.3). In 2016 and 2017 that jumped up slightly. Many of the other MSAs posted improvements (Figure 6), but they were not as pronounced as the Reading Language Arts scores.
Figure 6: Average Test Scores for Grades 3-8 for Math by Year
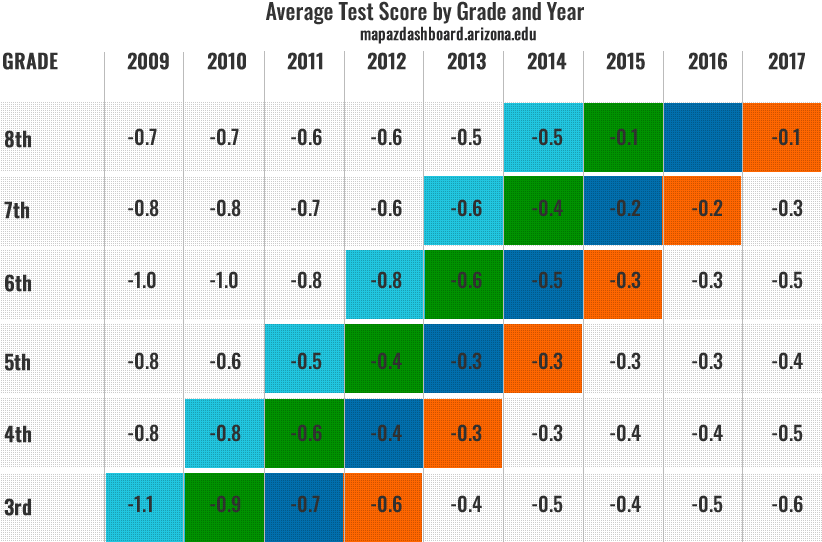
Lastly, the SEDA data allows us to follow cohorts from 3rd to 8th grade to track the changes in their scores compared to the national average. The visualization below highlights several cohorts and their progress in Reading Language Arts and math. For example, third-graders in the Tucson MSA in 2009 were more than one grade level behind at -1.1. However, in 2014 when that same cohort was in eighth grade, their average score had improved to only half a grade level behind. The visualization below also allows us to see that not all cohorts start from the same place relative to their national peers. For example, in 2009 3rd graders were more than one grade level behind but 3rd graders in 2015 were less than half a grade level behind.
Figure 7: Average Test Score for all Subjects by 3rd through 8th Grade Cohorts
It is important to track standardized test scores as they are one measure of a region’s ability to prepare its youth for the demands of higher education and a career. Creating skilled and productive future workers benefits the local economy and maintaining a high-quality school system can attract a talented workforce to the area. In addition to the significant economic effects of developing a skilled workforce, good school systems raise the desirability of an area from a quality of life perspective. Low student achievement means that students may be ill-equipped to attend college or perform high-skilled labor. Low-performing schools also may be indicative of socioeconomic challenges in the community, such as poverty. To learn more about student achievement scores in Arizona’s counties visit the core indicator on the MAP.


