 In 2022, Housing Affordability Declines in Tucson, Arizona MSA
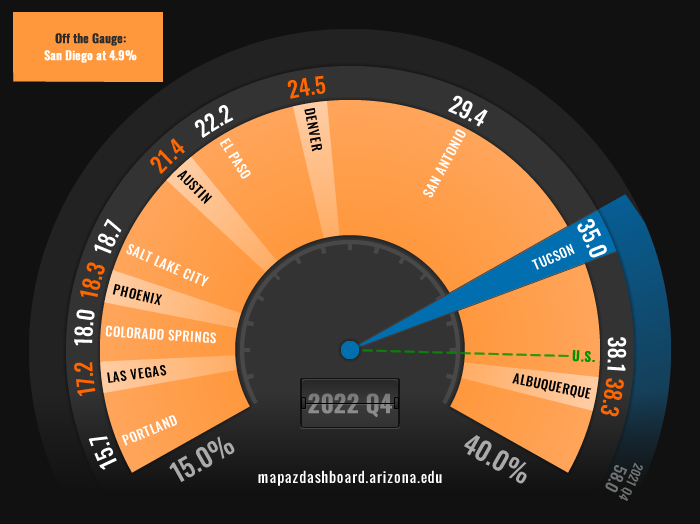
Tucson’s home prices have increased rapidly over the past few years, far outpacing income gains. Combined with spiking mortgage interest rates, this has resulted in plummeting housing affordability across the nation. In the fourth quarter of 2022, 35.0% of homes sold in Tucson were considered affordable for a family earning the local median income. That ranked Tucson second among peers, behind Albuquerque. Nationally 38.1% of homes in the U.S. were affordable. Despite the significant decline in the percent of affordable homes available to those earning the median family income, Tucson remains one of the most affordable places to buy a home when compared to peer Metropolitan Statistical Areas (MSAs).
Figure 1: Housing Affordability 4th Quarter of 2022
When exploring housing affordability rates for 2022 for Arizona MSAs, Tucson fell in the middle at 35.0%. Sierra Vista had the highest percentage of homes affordable to someone earning the local median family income at 41.3%, followed by Yuma at 38.3% (Figure 2). Phoenix and Flagstaff had the lowest rates at 18.3% and 15.6%, respectively.
Figure 2: Housing Affordability for Arizona MSAs (4th Quarter 2022)
Housing affordability has declined since 2020 for all MSAs tracked on the MAP Dashboard (Figure 3). Tucson’s decline of 23 percentage points between the fourth quarter of 2021 and the fourth quarter of 2022 was comparable to the losses felt among all MSAs tracked. These declines were driven both by prior increases in house prices and the doubling of mortgage interest rates during 2022.
Figure 3: Housing Affordability Trend
Tucson’s single-family home prices increased by 12.3% in 2022 to $371,900 (Figure 4). Tucson’s increase in home prices in 2022 was about half of the gain posted in 2021, when prices increased by a whopping 24.9%. Home prices have steadily increased in Tucson since the Great Recession with a significant acceleration in prices over the past three years. Despite the recent growth, Tucson has a relatively low median home price when compared to its peers. Only three MSAs measured on the MAP reported lower single-family median home prices in 2022. El Paso posted the lowest median home price at $237,100, followed by San Antonio and Albuquerque. San Diego’s median home price in 2022 was nearly $250,000 higher than the next MSA tracked on the MAP at $911,000. Denver, at $670,100, had the second highest median home price among the 12 MSAs.
Figure 4: Median Home Prices
Despite the rapid growth in home prices in 2022, the gains were not evenly spread throughout the year. Tucson’s median home price reached a peak in the second quarter of 2022 at $380,700 and then declined in the third and fourth quarters. This trend was consistent across the MSAs tracked on the MAP and the nation. Figure 5 illustrates the uneven growth in median home prices for the U.S. and the 12 MSAs. Home prices in Tucson grew by 3.0% in the first quarter of 2022, 5.7% in the second quarter, and then declined by -1.2% and -2.1% in the third and fourth quarters. Tucson’s change in home prices during 2022 were small relative to other MSAs like Austin, which posted quarterly changes over 11%.
Figure 5: Percent Change in Median Home Price by Quarter (2022)
Housing affordability was also driven down in 2022 by a substantial increase in interest rates. The 30-year fixed-rate average mortgage interest rate in the first quarter of 2022 was 3.82% which increased to 5.27% in the second quarter and 5.62% in the third quarter (Figure 6). The fourth quarter 30-year interest rate was 6.66%, nearly three percentage points higher than it was at the beginning of the year. Even slight increases in the interest rate can impact how much someone can borrow for a mortgage. According to the Consumer Affairs website, a 1% increase in the mortgage rate drops the price of a home that someone can afford by more than $45,000 (that assumes a monthly income of $4,500 and a debt-to-income ratio of 36%, with 20% down).
Figure 6: 30-Year Fixed Rate Mortgage Average for the U.S.
The MAP Dashboard is constantly adding new feature articles and updated information to the website. Stay tuned for emerging trends in the housing market, how much you can afford to spend at varying income levels without being considered housing cost burdened, and how your Southern Arizona community fares in housing cost burden rates.